How to Customize and Share a Google Sheets Chart ?
|
 Google
|
Google
|
Aug 06, 2024
|
17 Steps
How to Customize and Share a Google Sheets Chart ?
|
Google
|
17 Steps

1
Navigate to https://docs.google.com
2
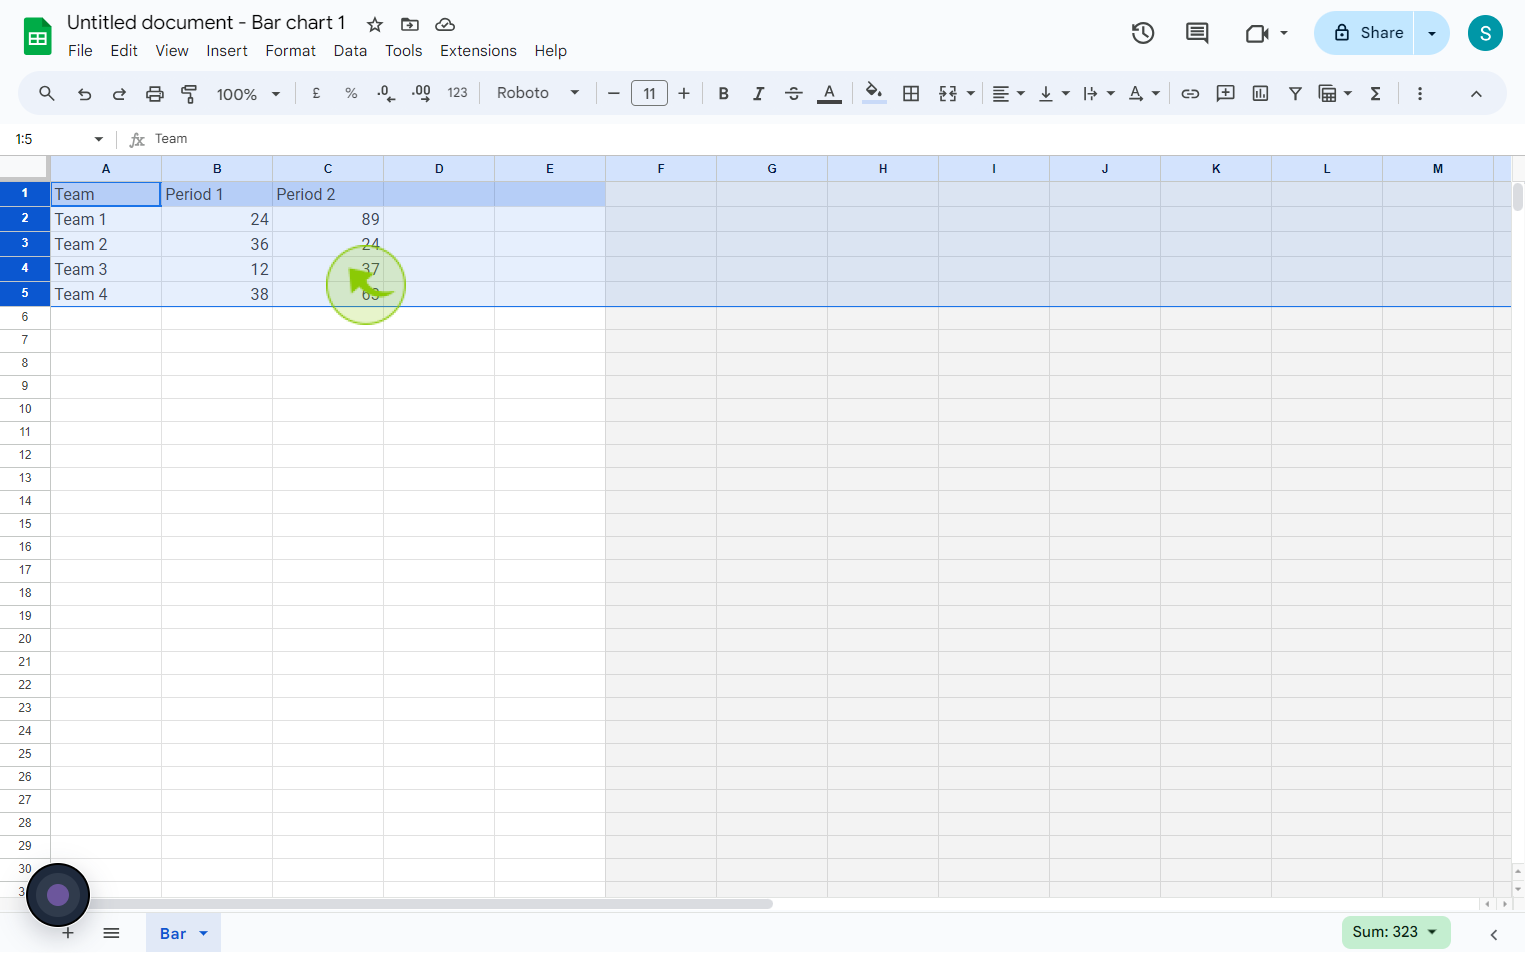
Select your "Data" by clicking and dragging over it.
3
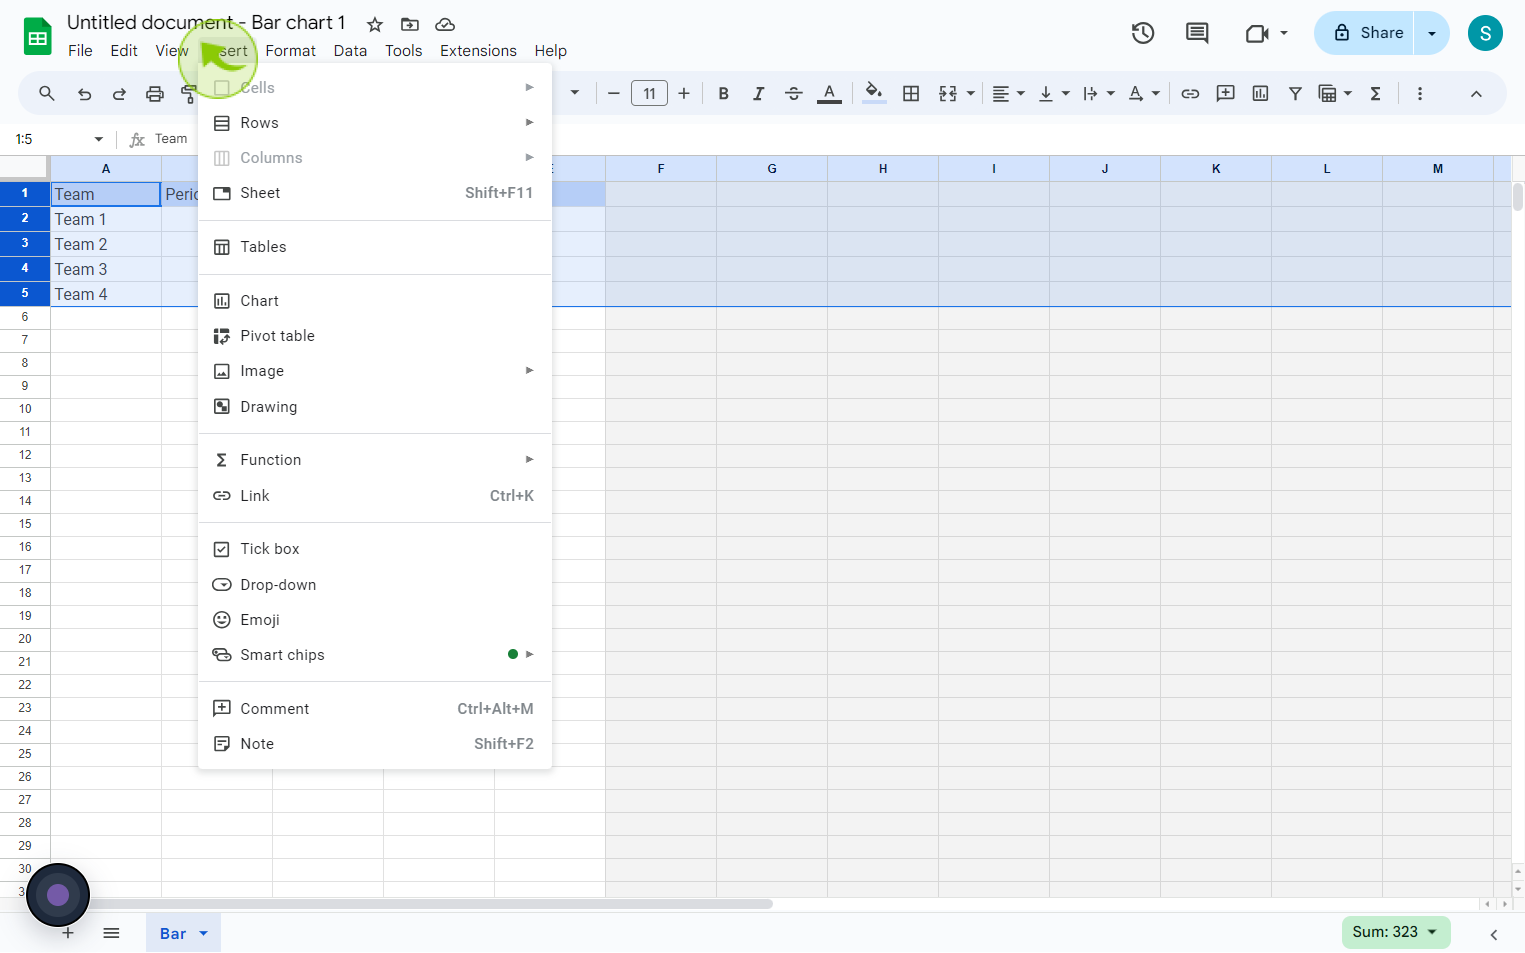
Click on the "Insert" tab
4
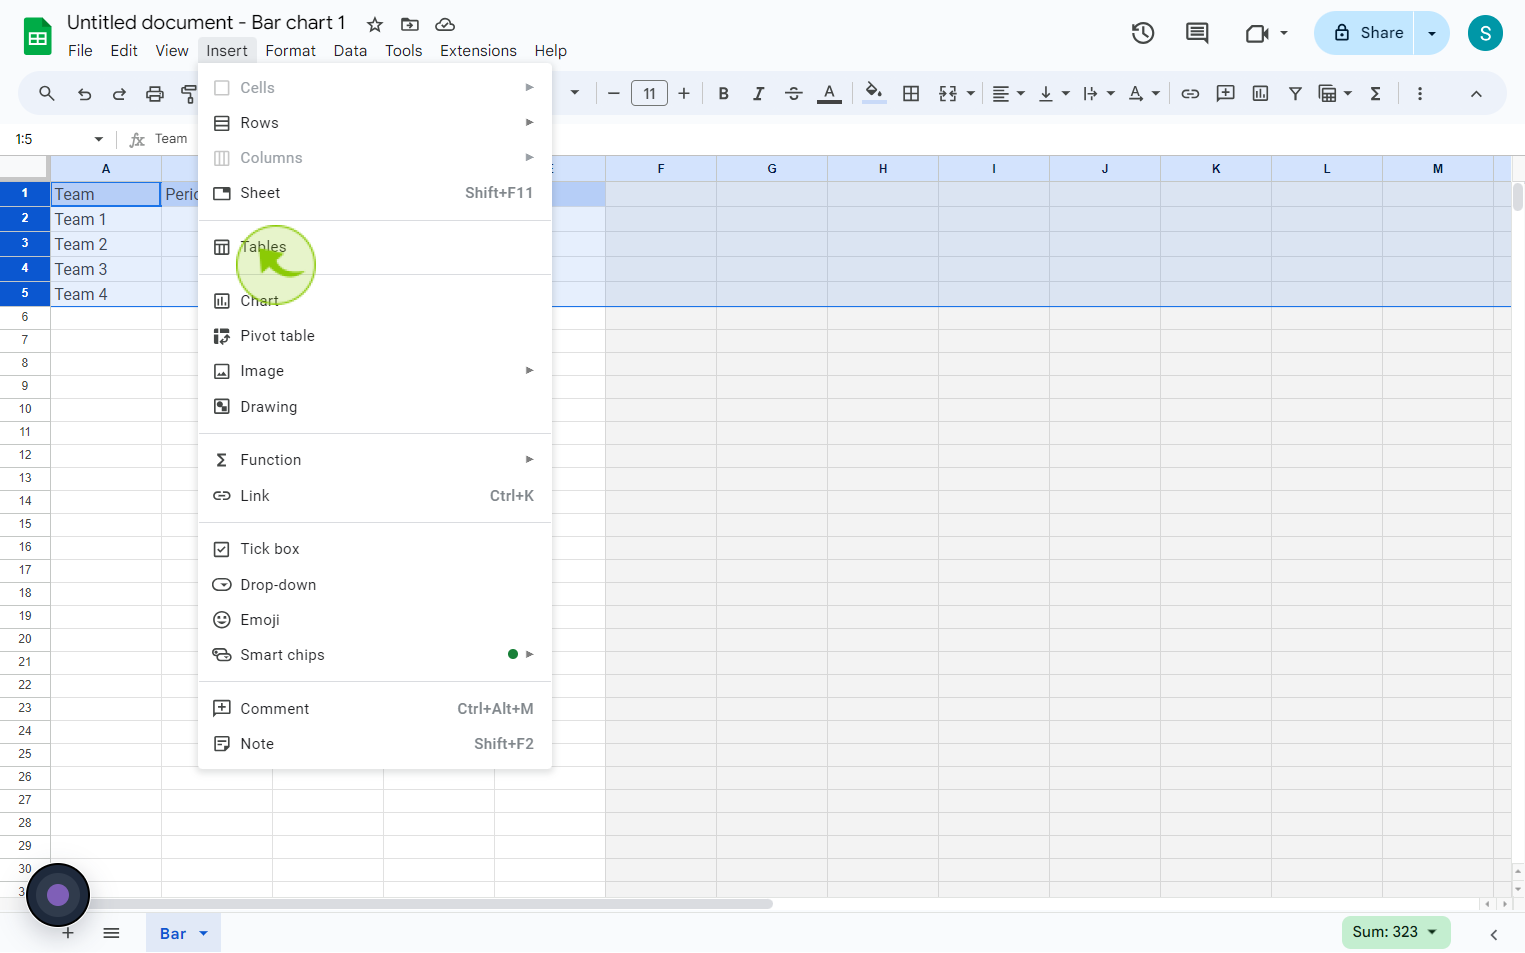
Click on the "Chart".
5
Click on "Customise"
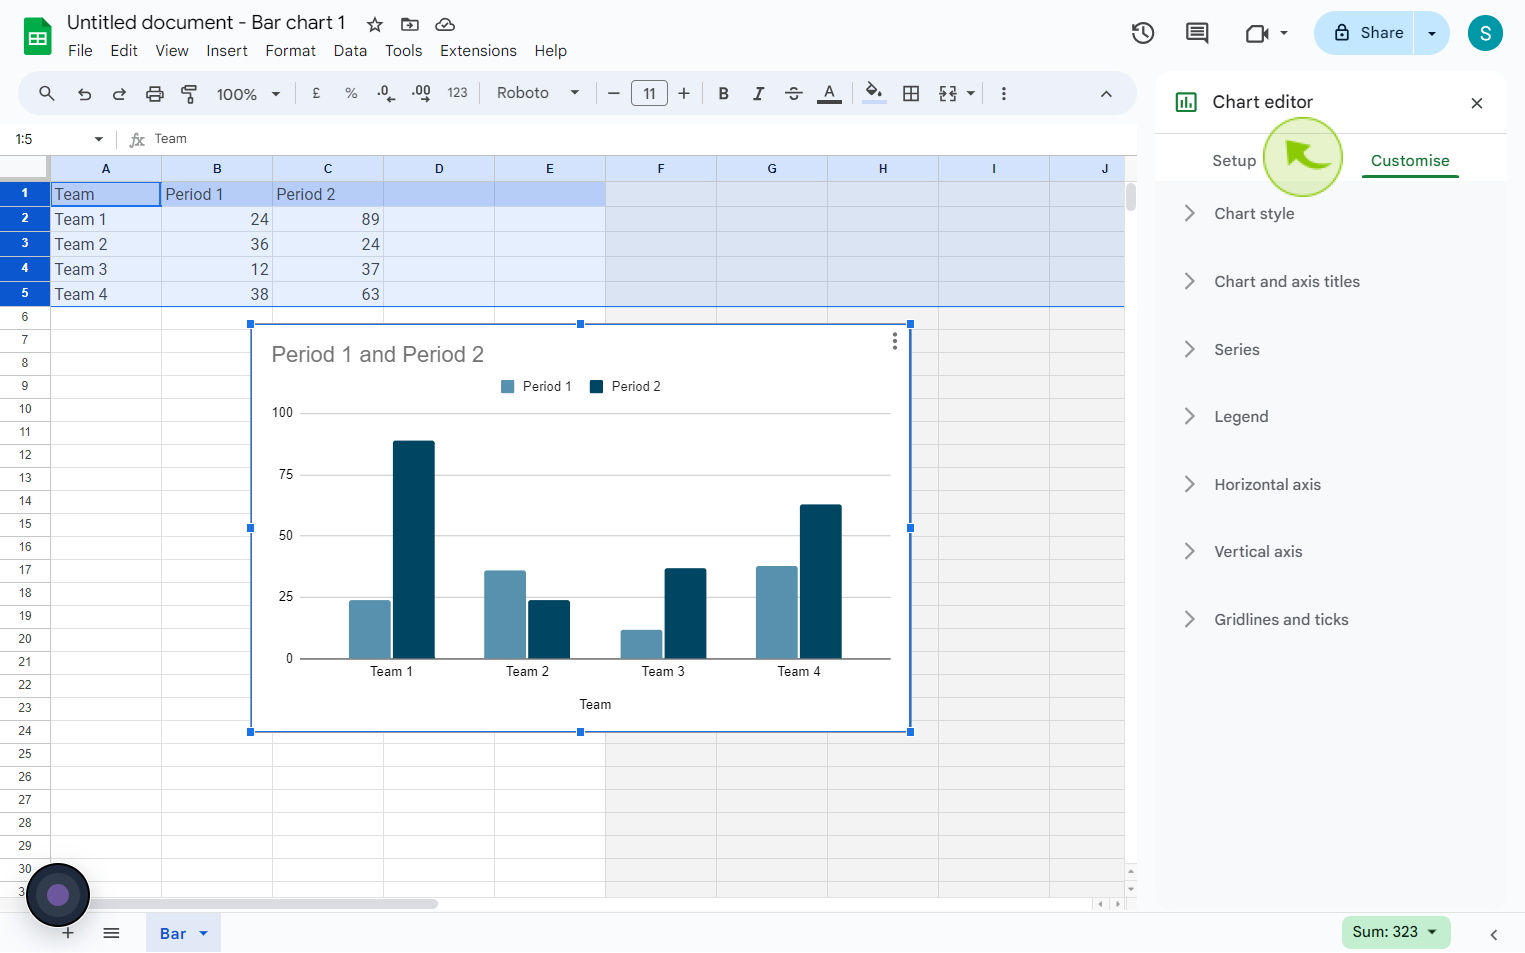
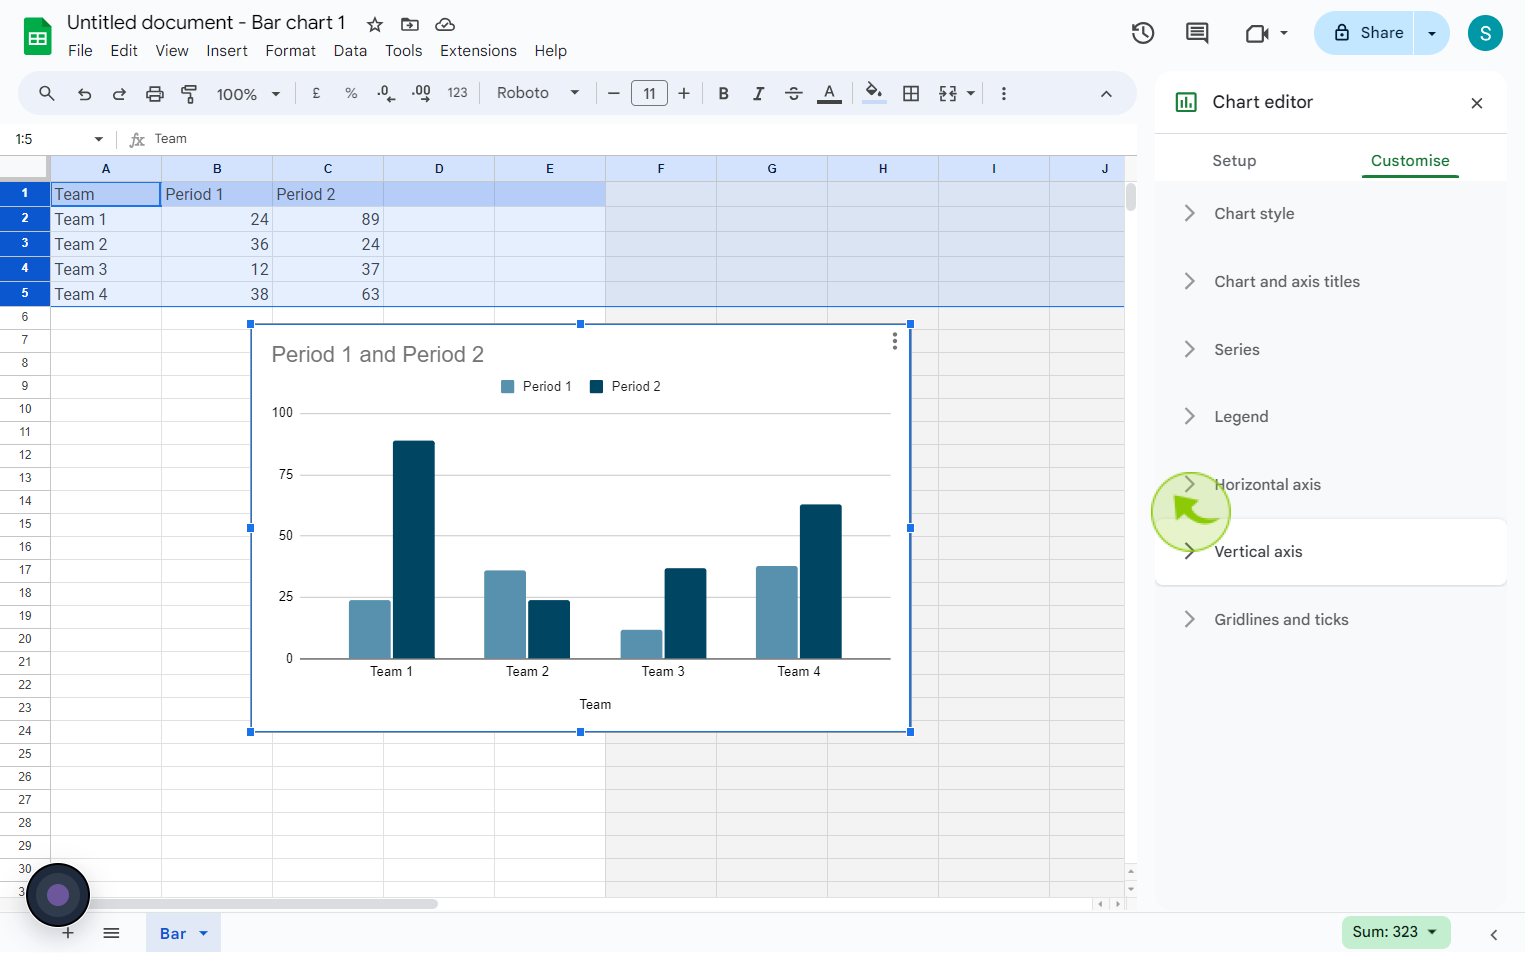
6
Click on "Vertical Axis"
7
Click the "Min" field.
Change and enter the minimum value based on how you want the graph to look
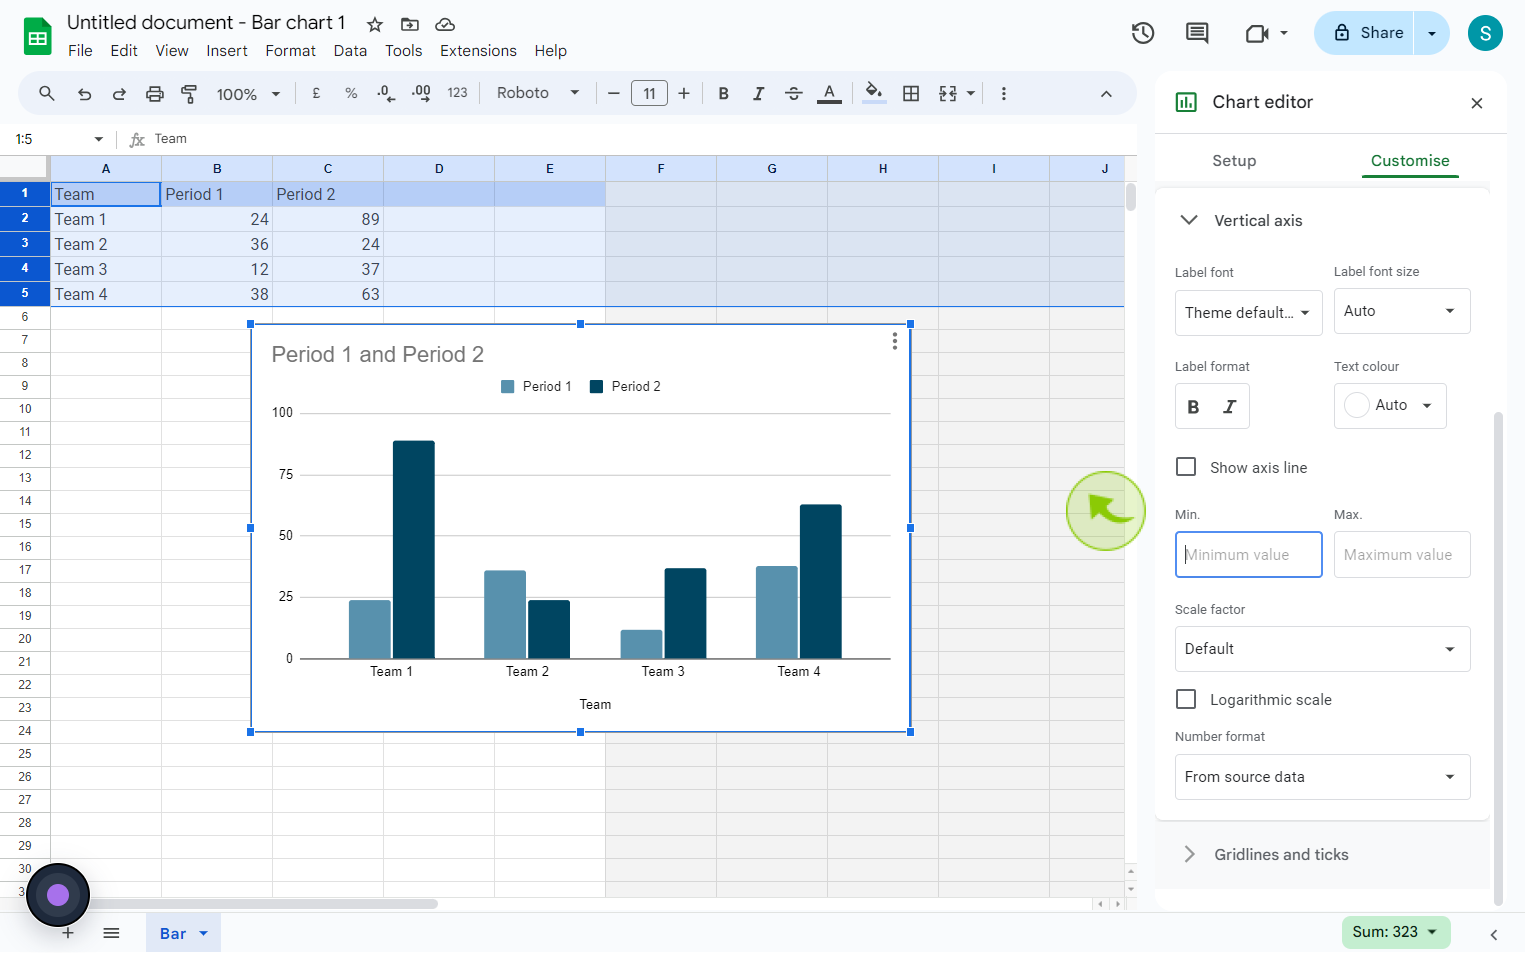
8
Click the "Max" field.
Change and enter the maximum value based on how you want the graph to look.

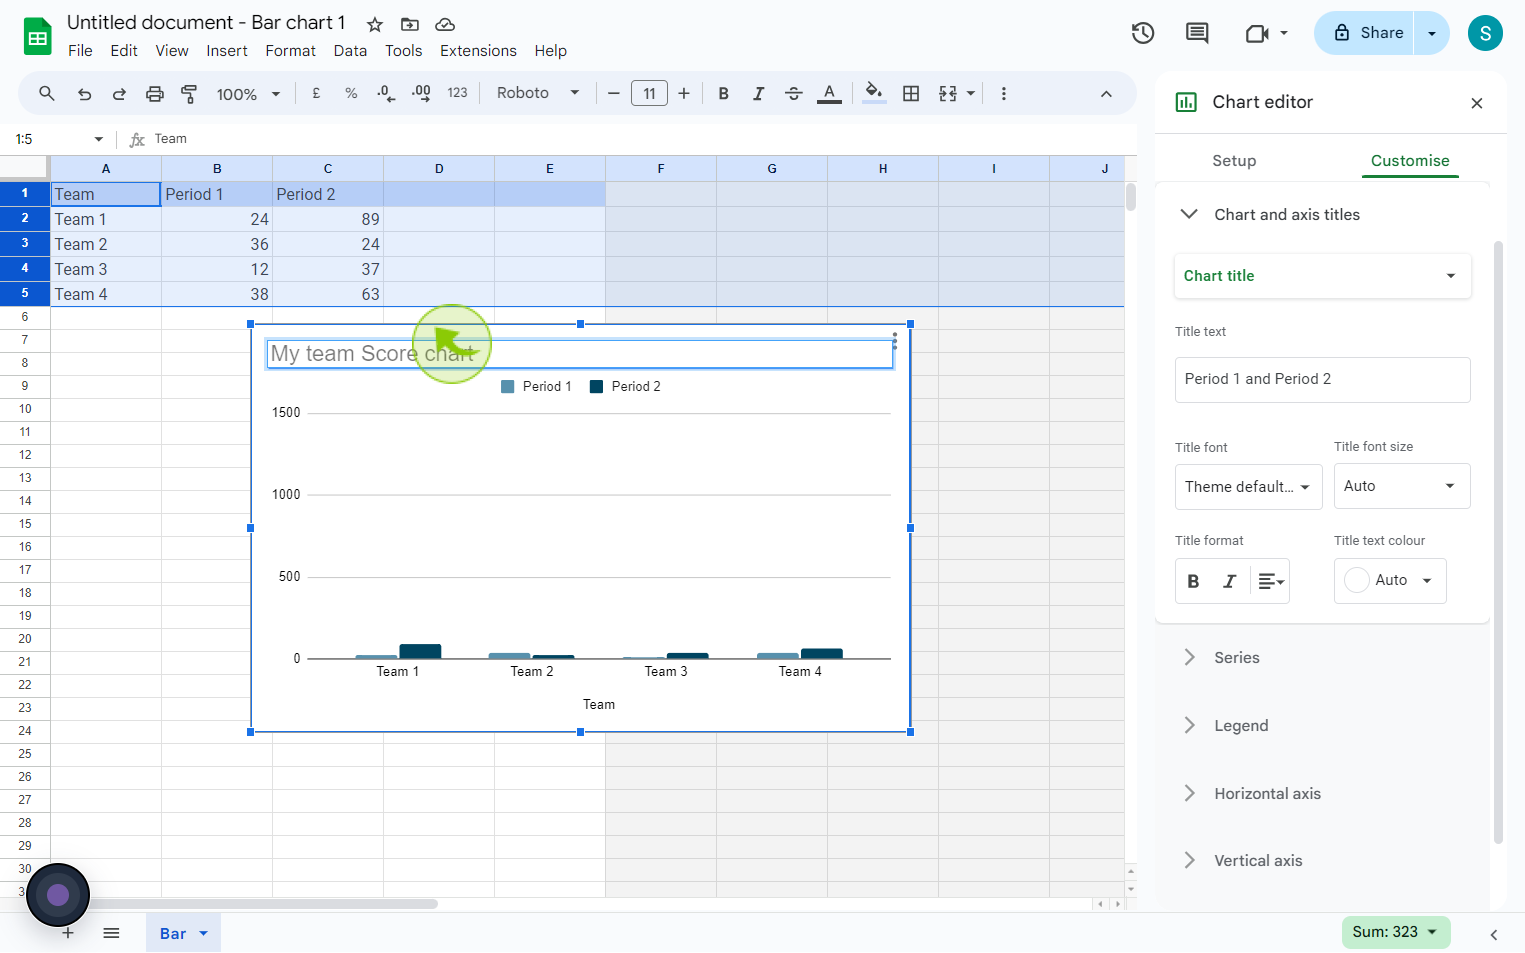
9
You can also edit the "Titles" on the graph by double clicking on the title and typing in a new title.
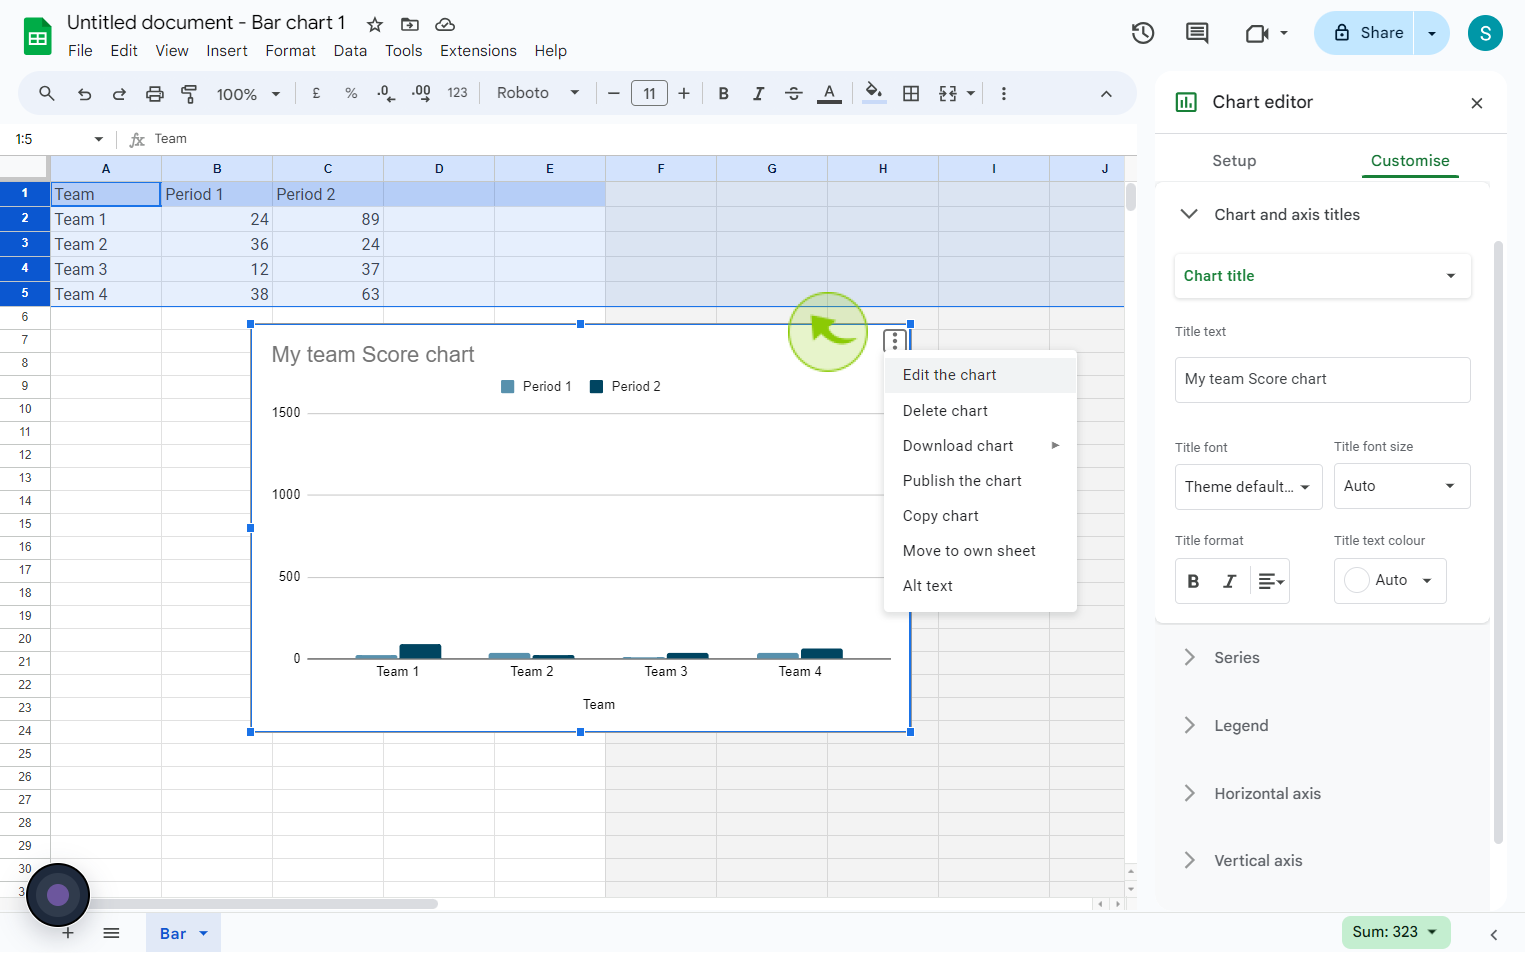
10
Click on "Three" dots.
You can also move your graphs to their own sheets, click options

11
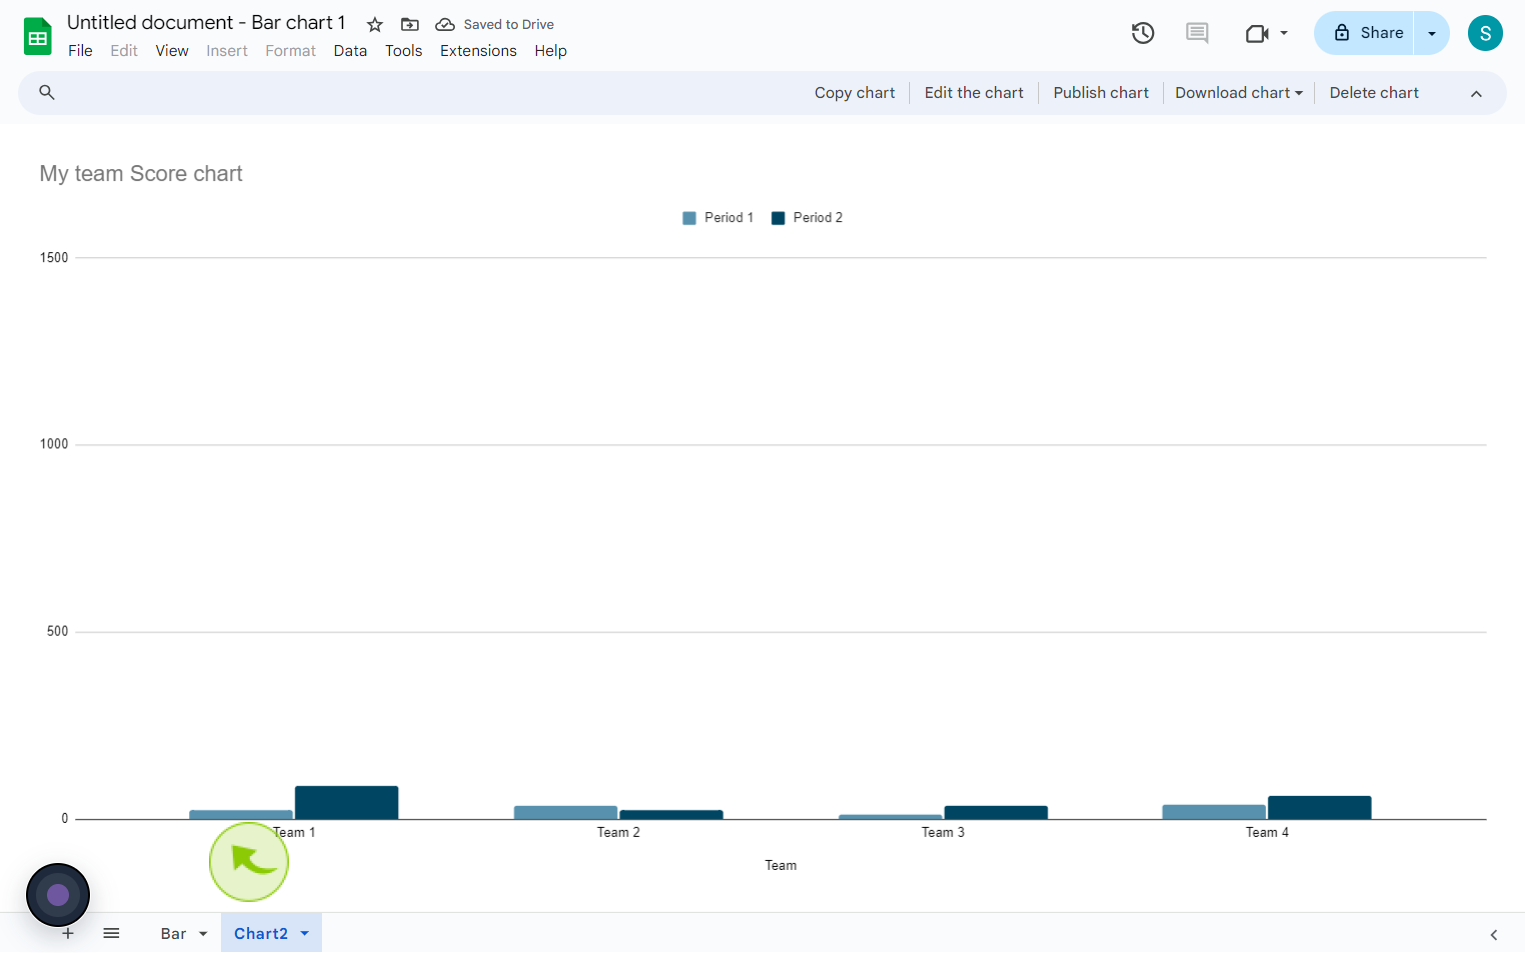
Click on the "Move to own Sheet"
12
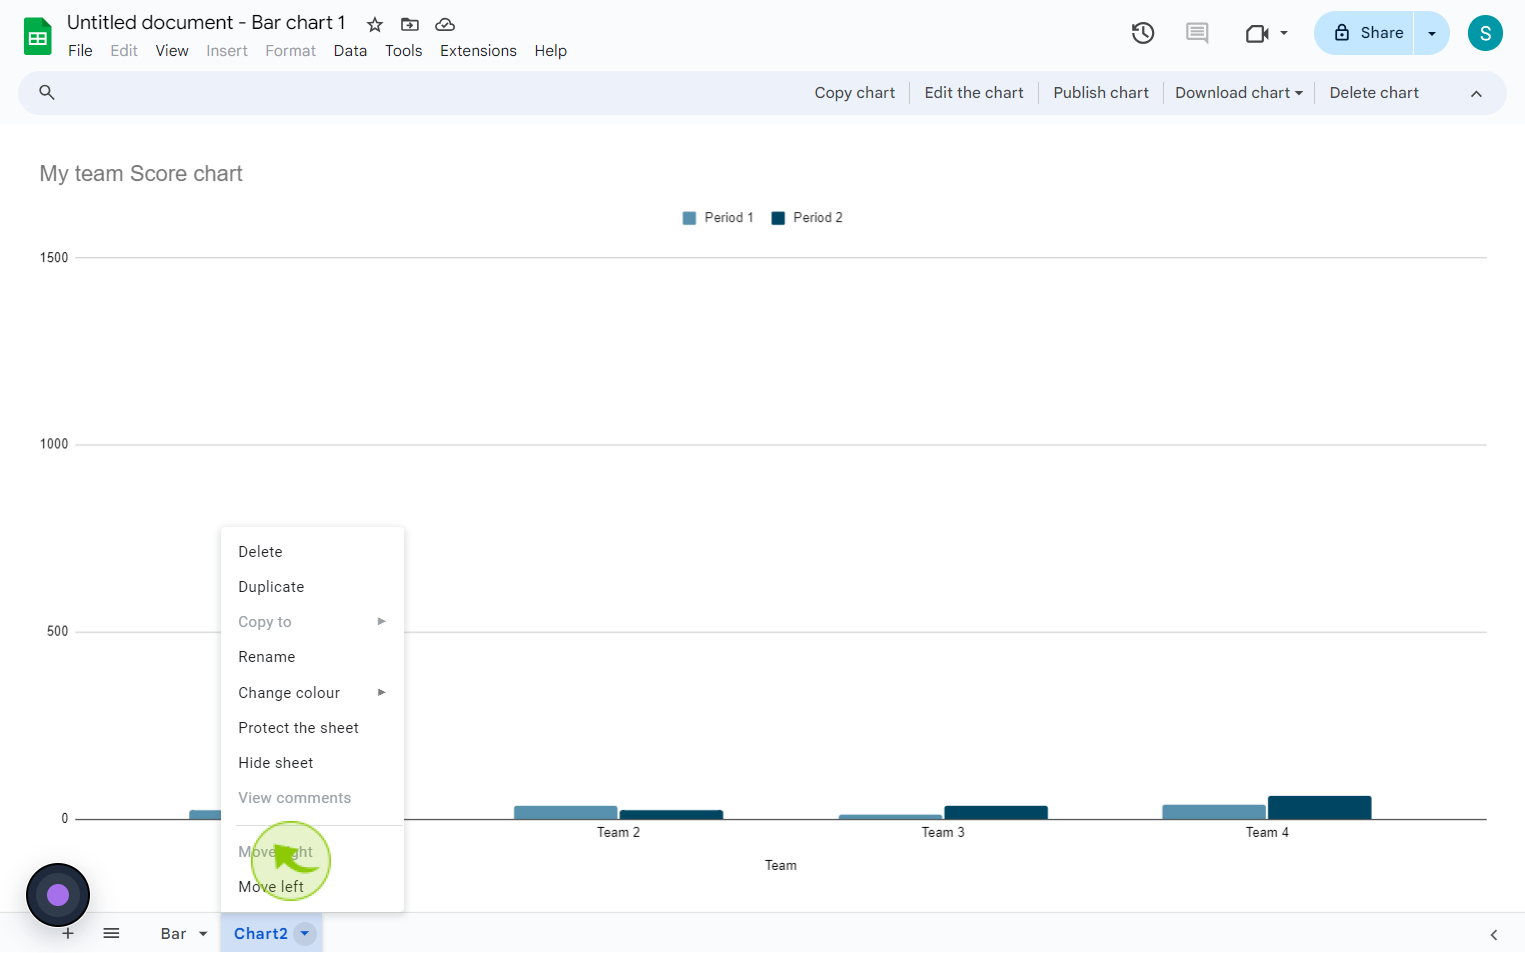
Right click on "Chart2"
You can rename the sheet so you can identify what is where.
13
Click on "Rename"
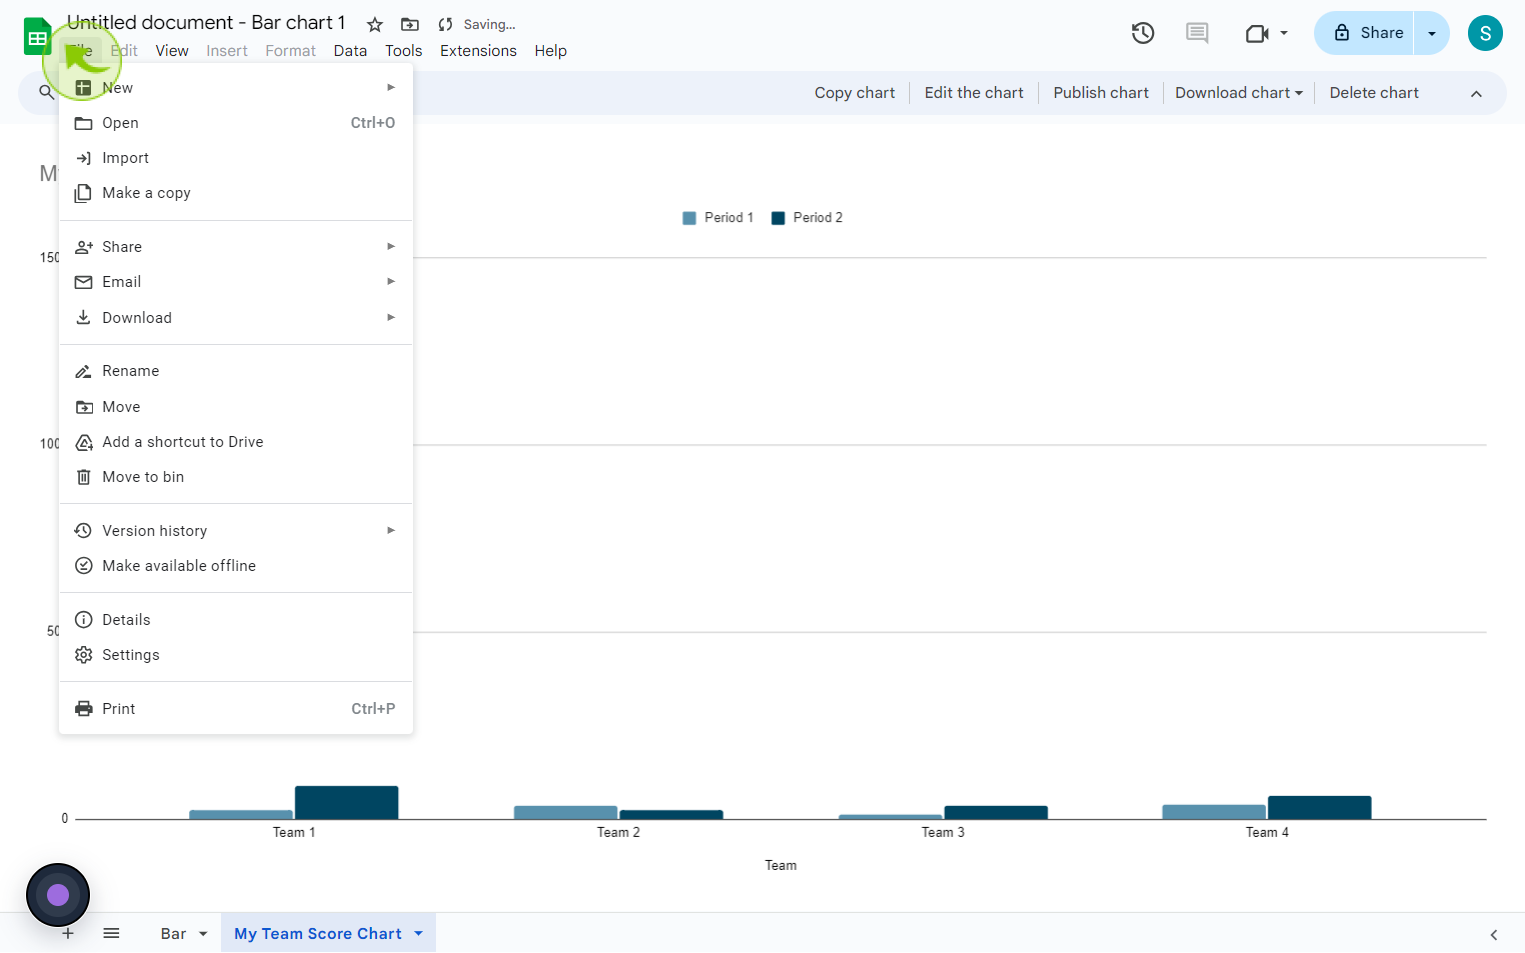
14
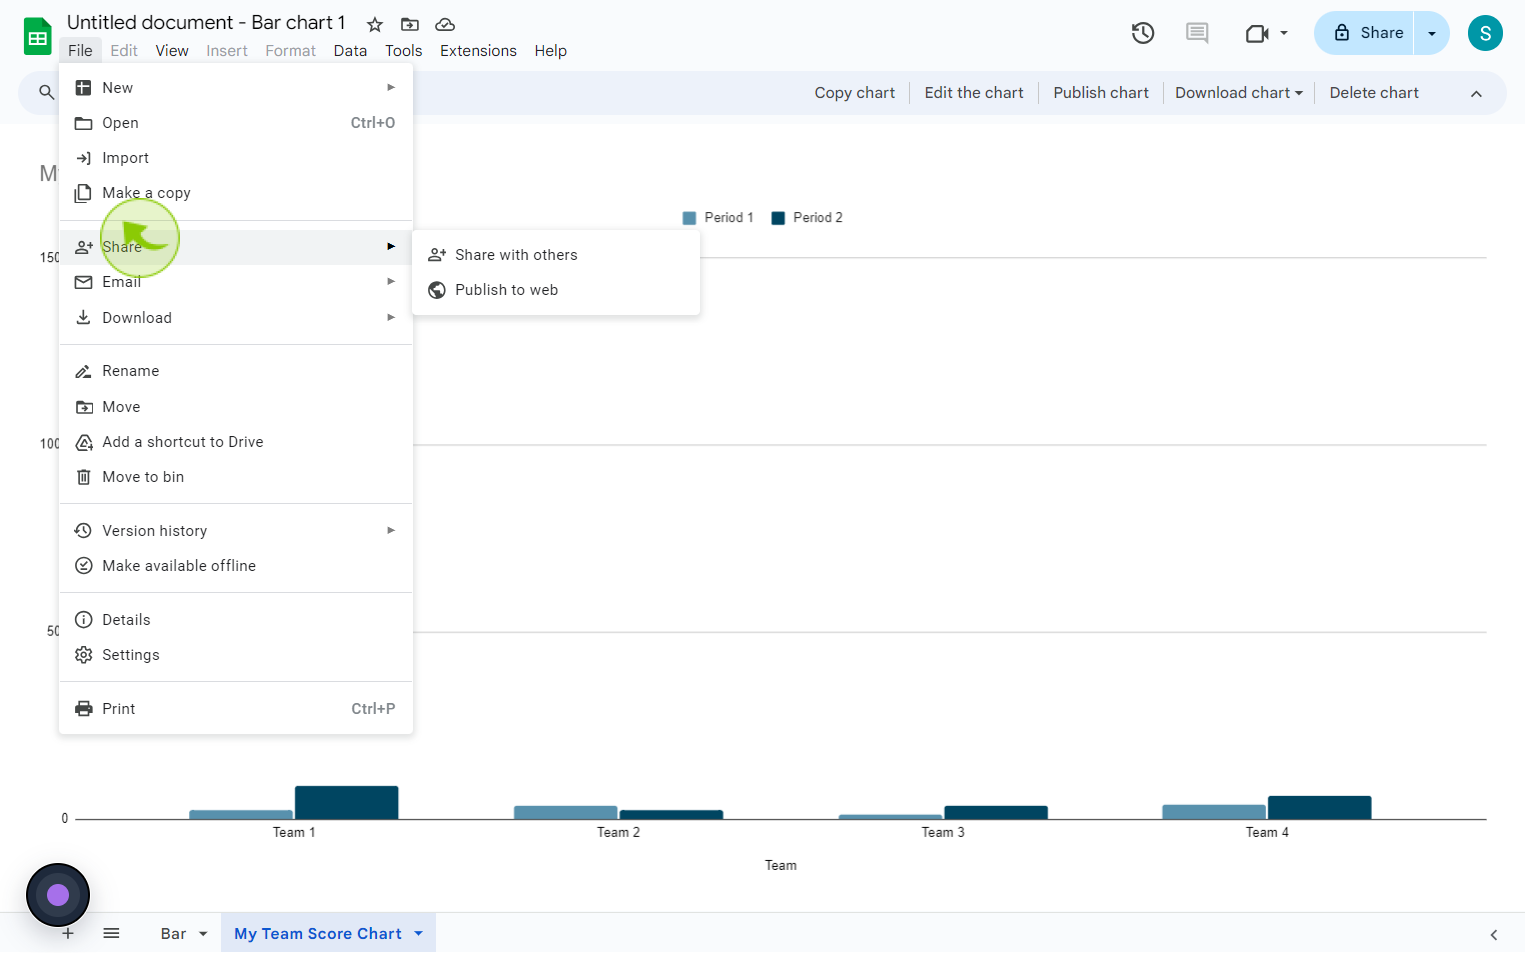
Click on "File"
Once you are done you are ready to share with me.
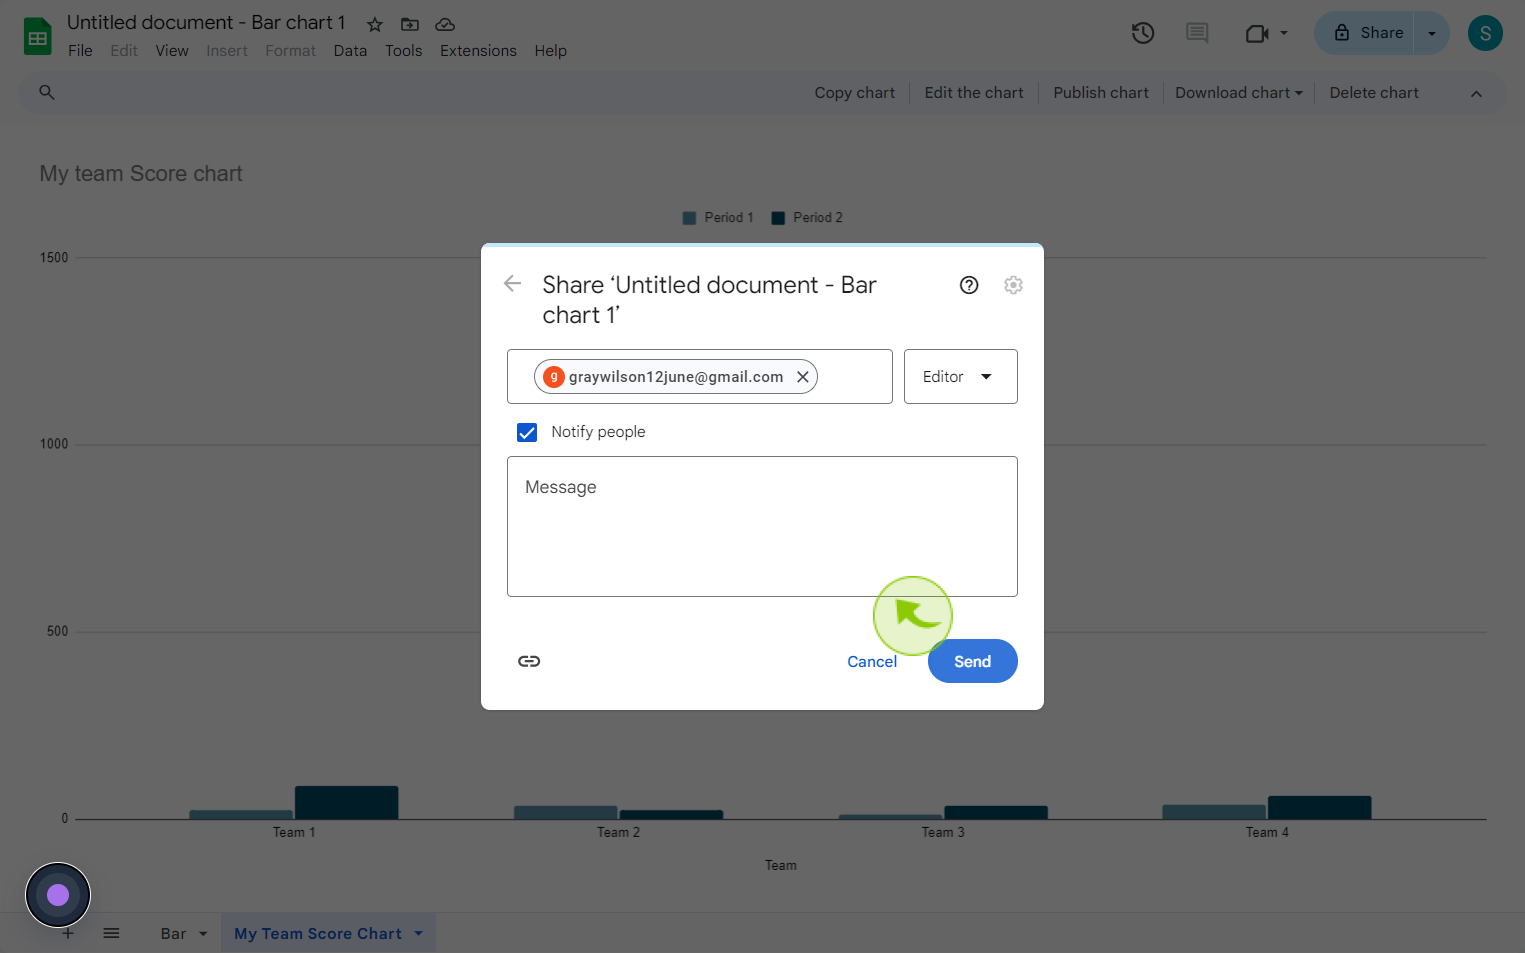
15
Click "Share" then "Share With Others".
16
Click on "Add People" and type in my name as is appears below
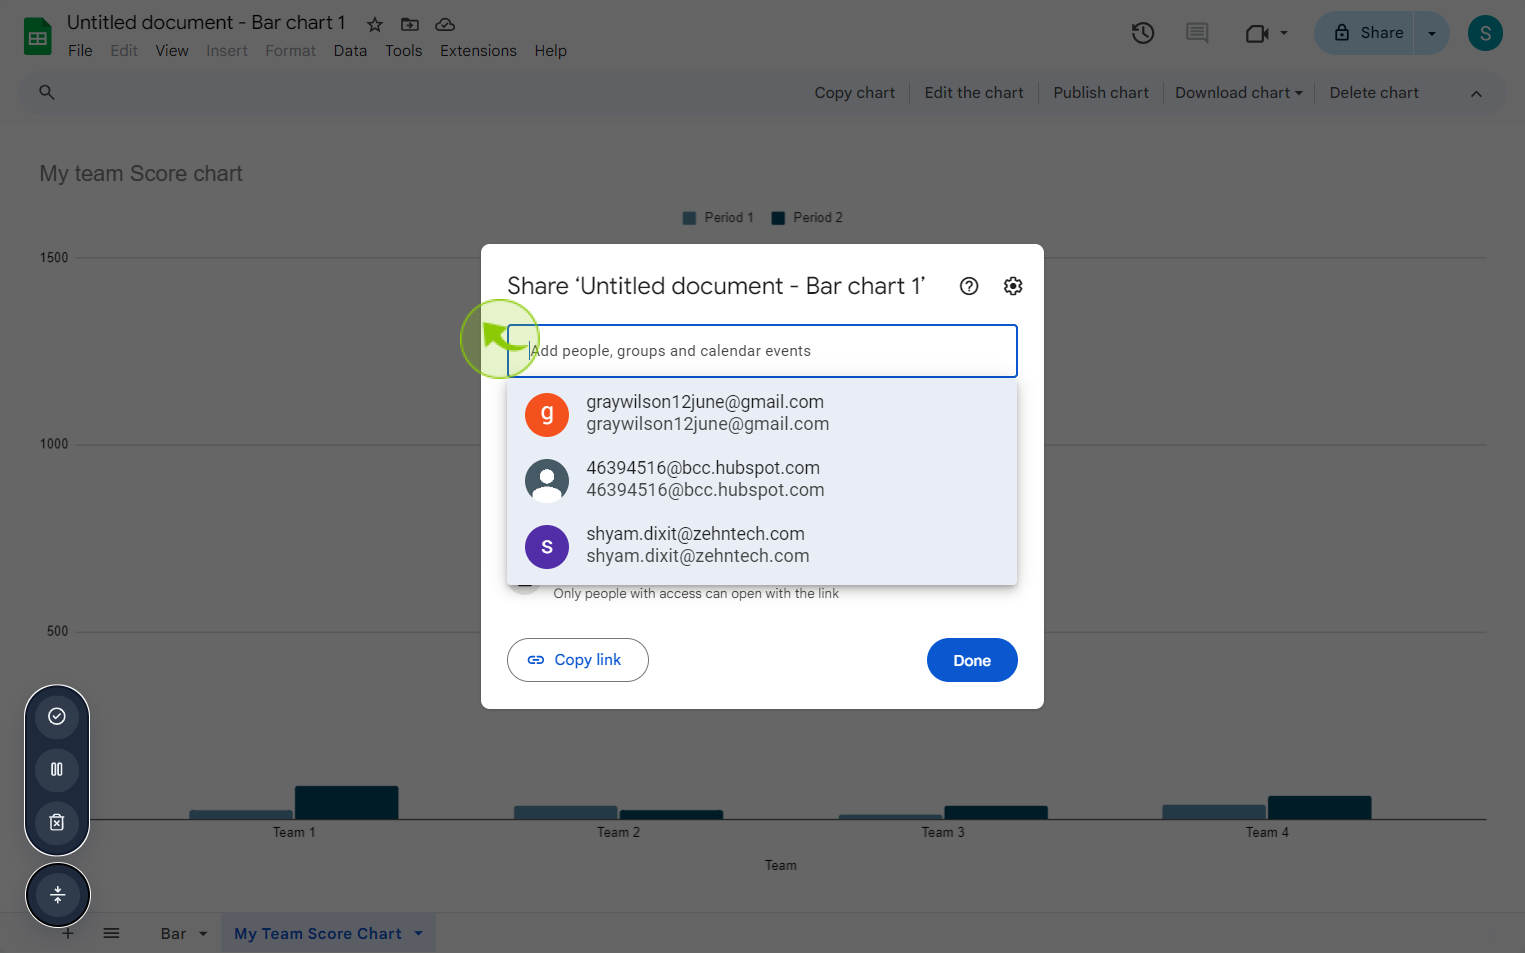
17
Click "Send"
By following these steps you can successfully customize and share a google sheets chart