How to make a chart in Google Docs ?
|
 Google Docs
|
Google Docs
|
Aug 05, 2024
|
9 Steps
This guide will show you how to easily create and customize charts within your Google Docs documents. Learn how to insert different chart types, such as bar charts, pie charts, and line graphs. Discover how to edit chart data, change colors and styles, and add labels for clear and effective data visualization.
How to make a chart in Google Docs ?
|
Google Docs
|
9 Steps

1
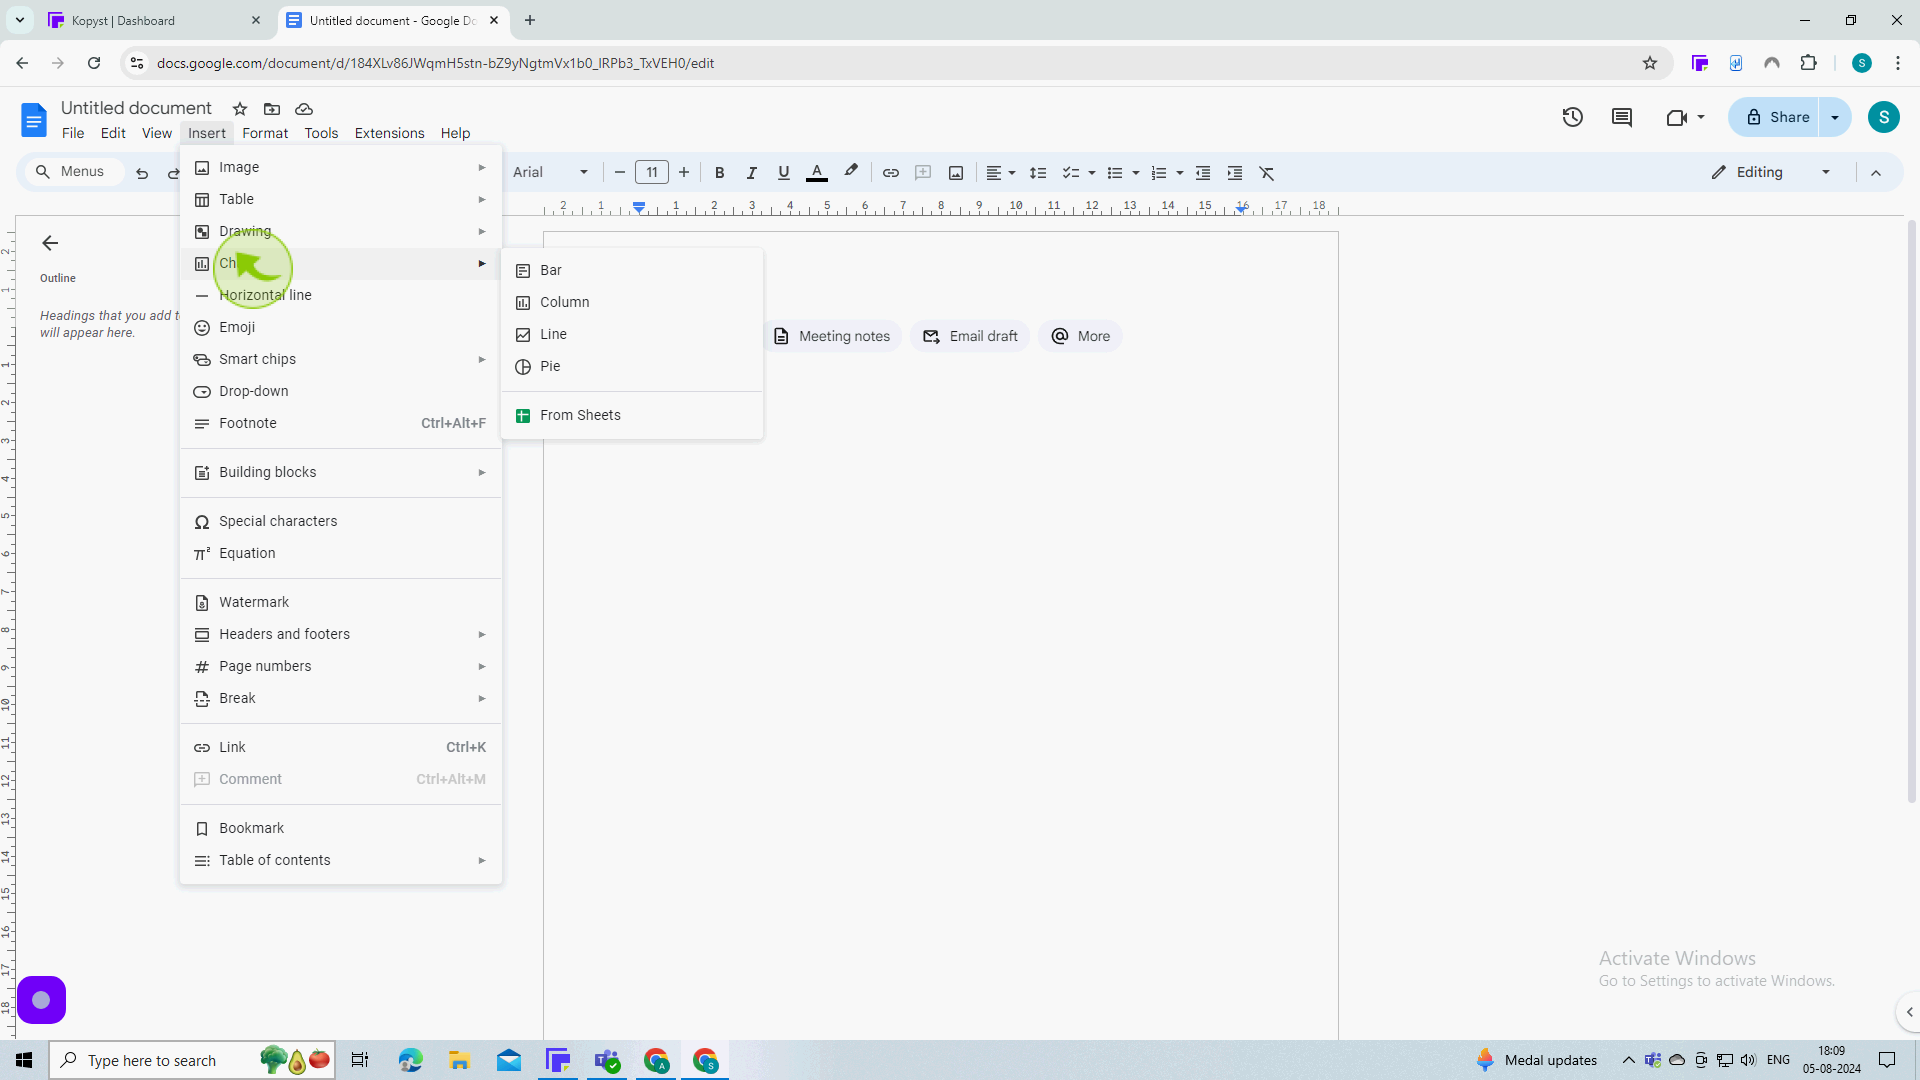
Click on the "Insert" from the toolbar at the top of the window.
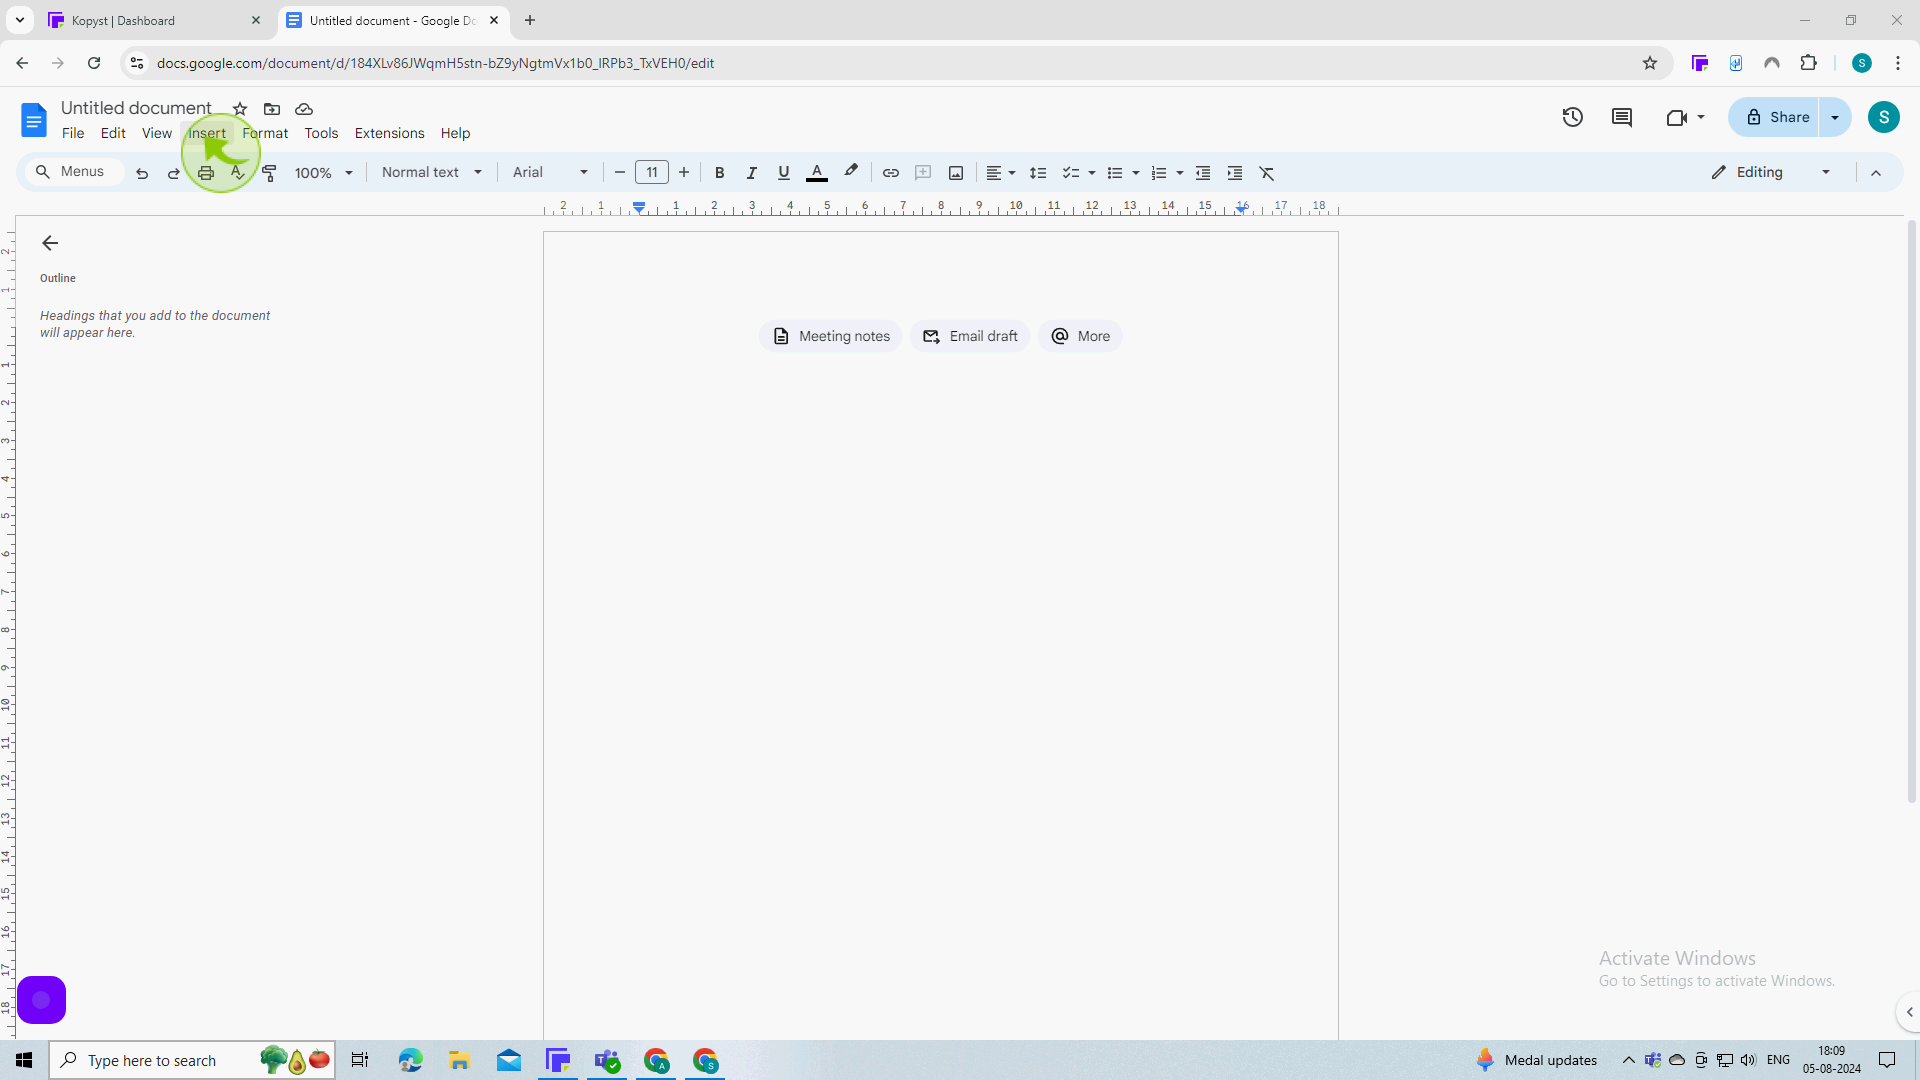
To get started, open a blank document in google docs.
2
Click "Chart"
3
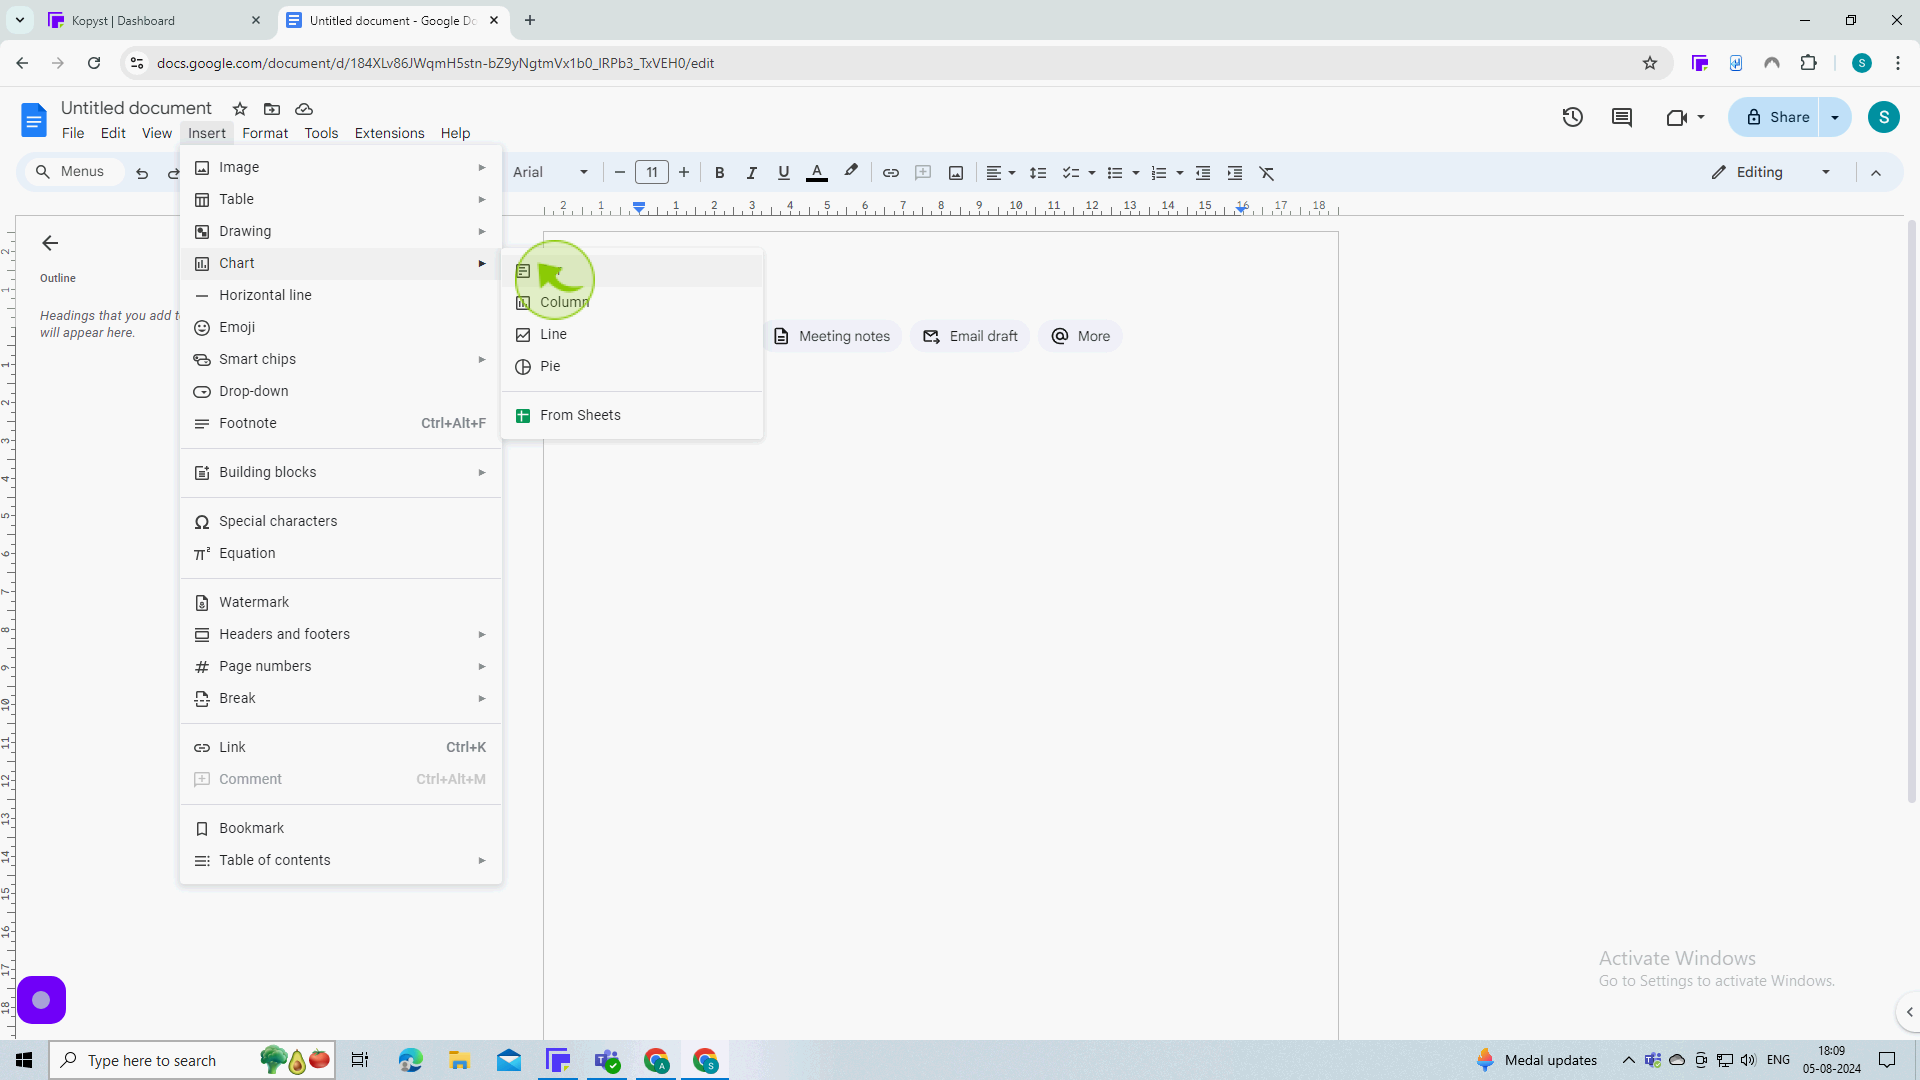
Select the "Type" of chart you want to insert from the dropdown menu
You want to insert type of chart from the dropdown menu.so i'm choosing bar
4
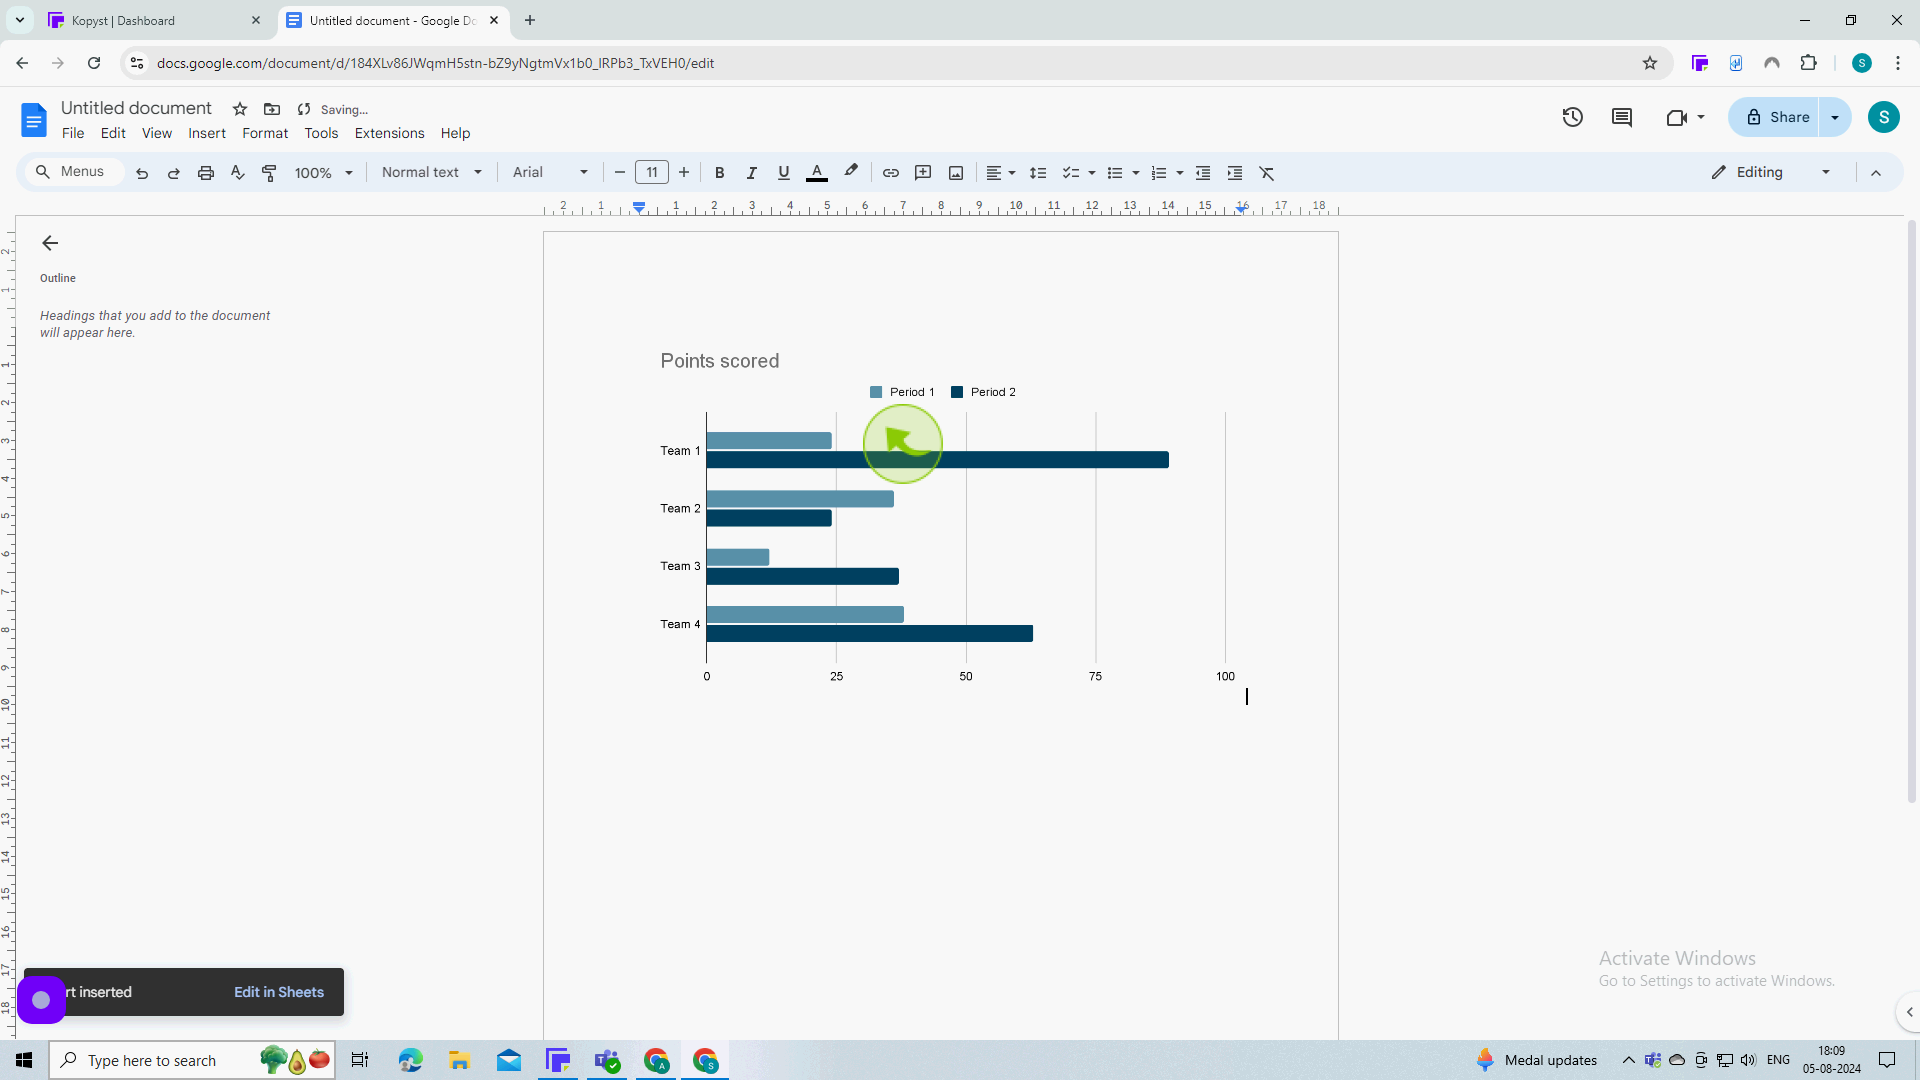
A "Chart" with default information will be added.
5
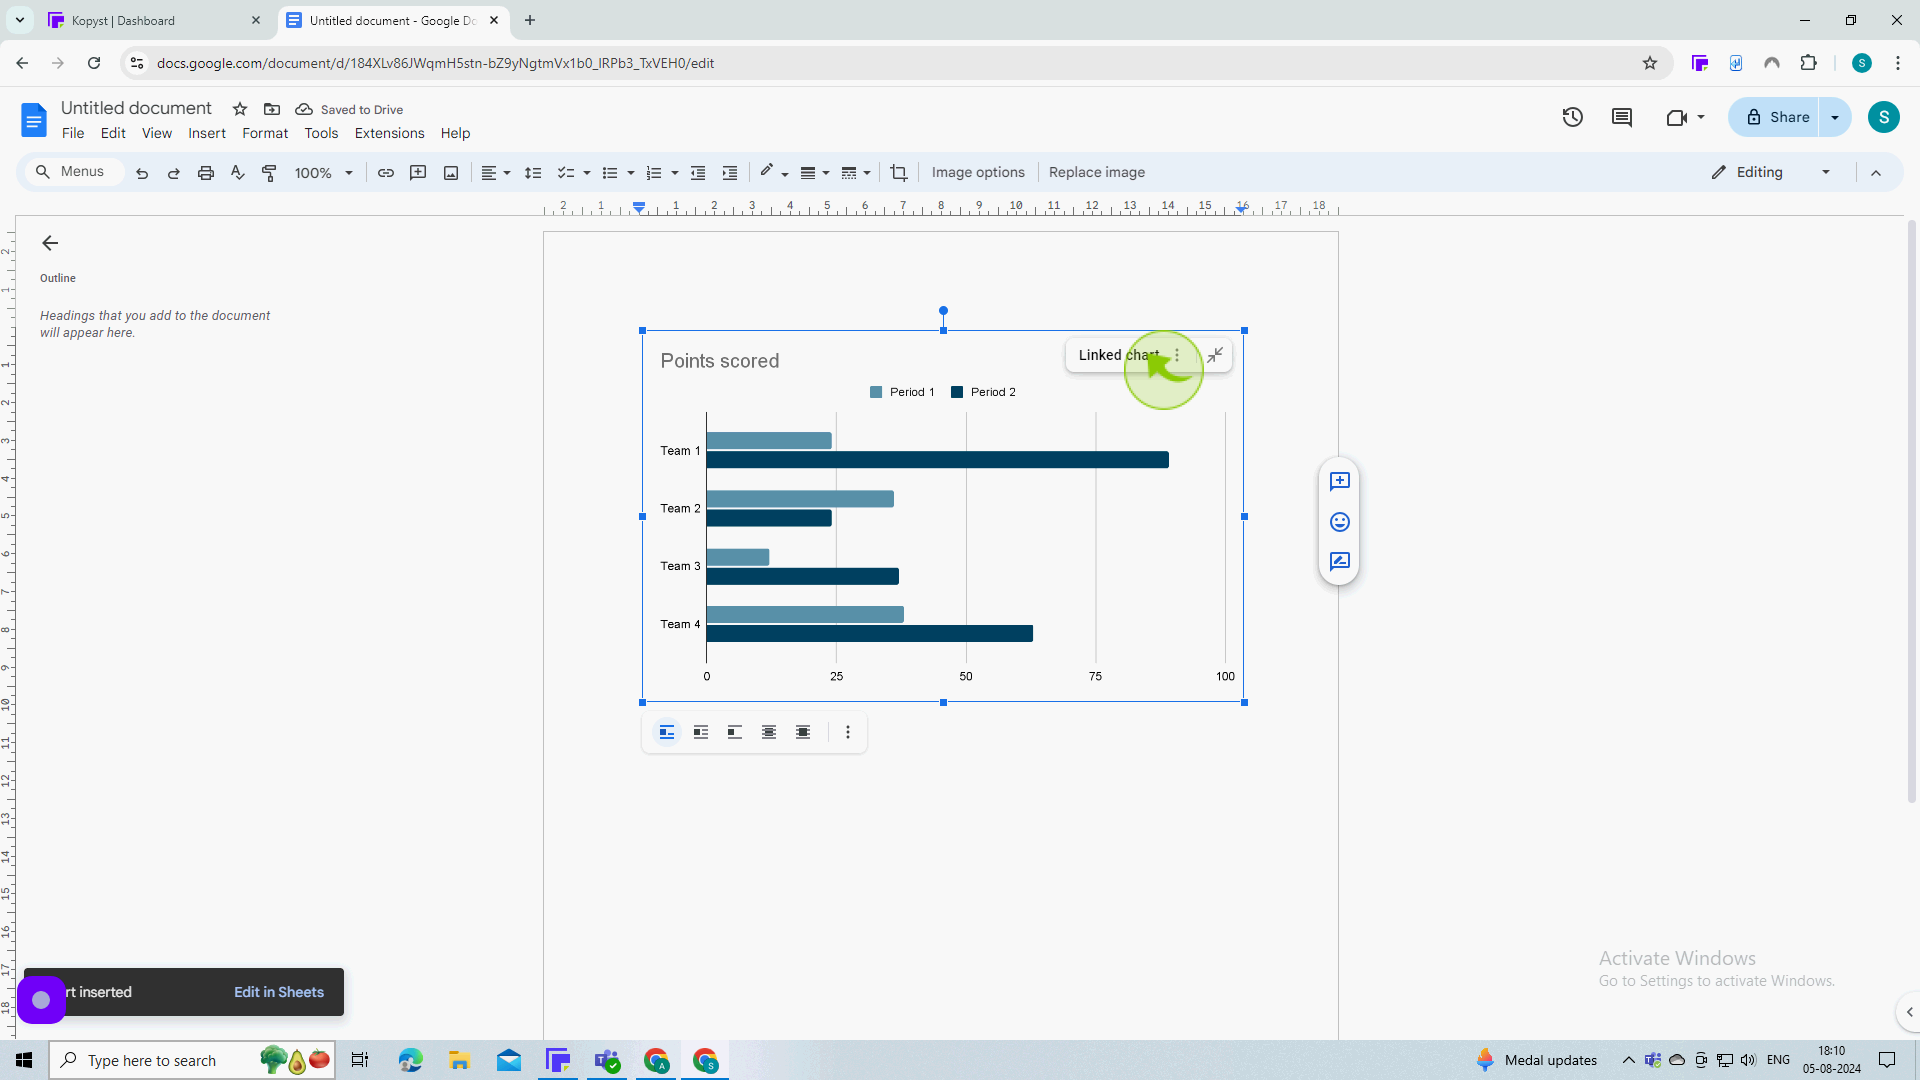
Click the "Three Dots".
To edit the data displayed in the "chart, you'll need to open the linked google sheet.
6
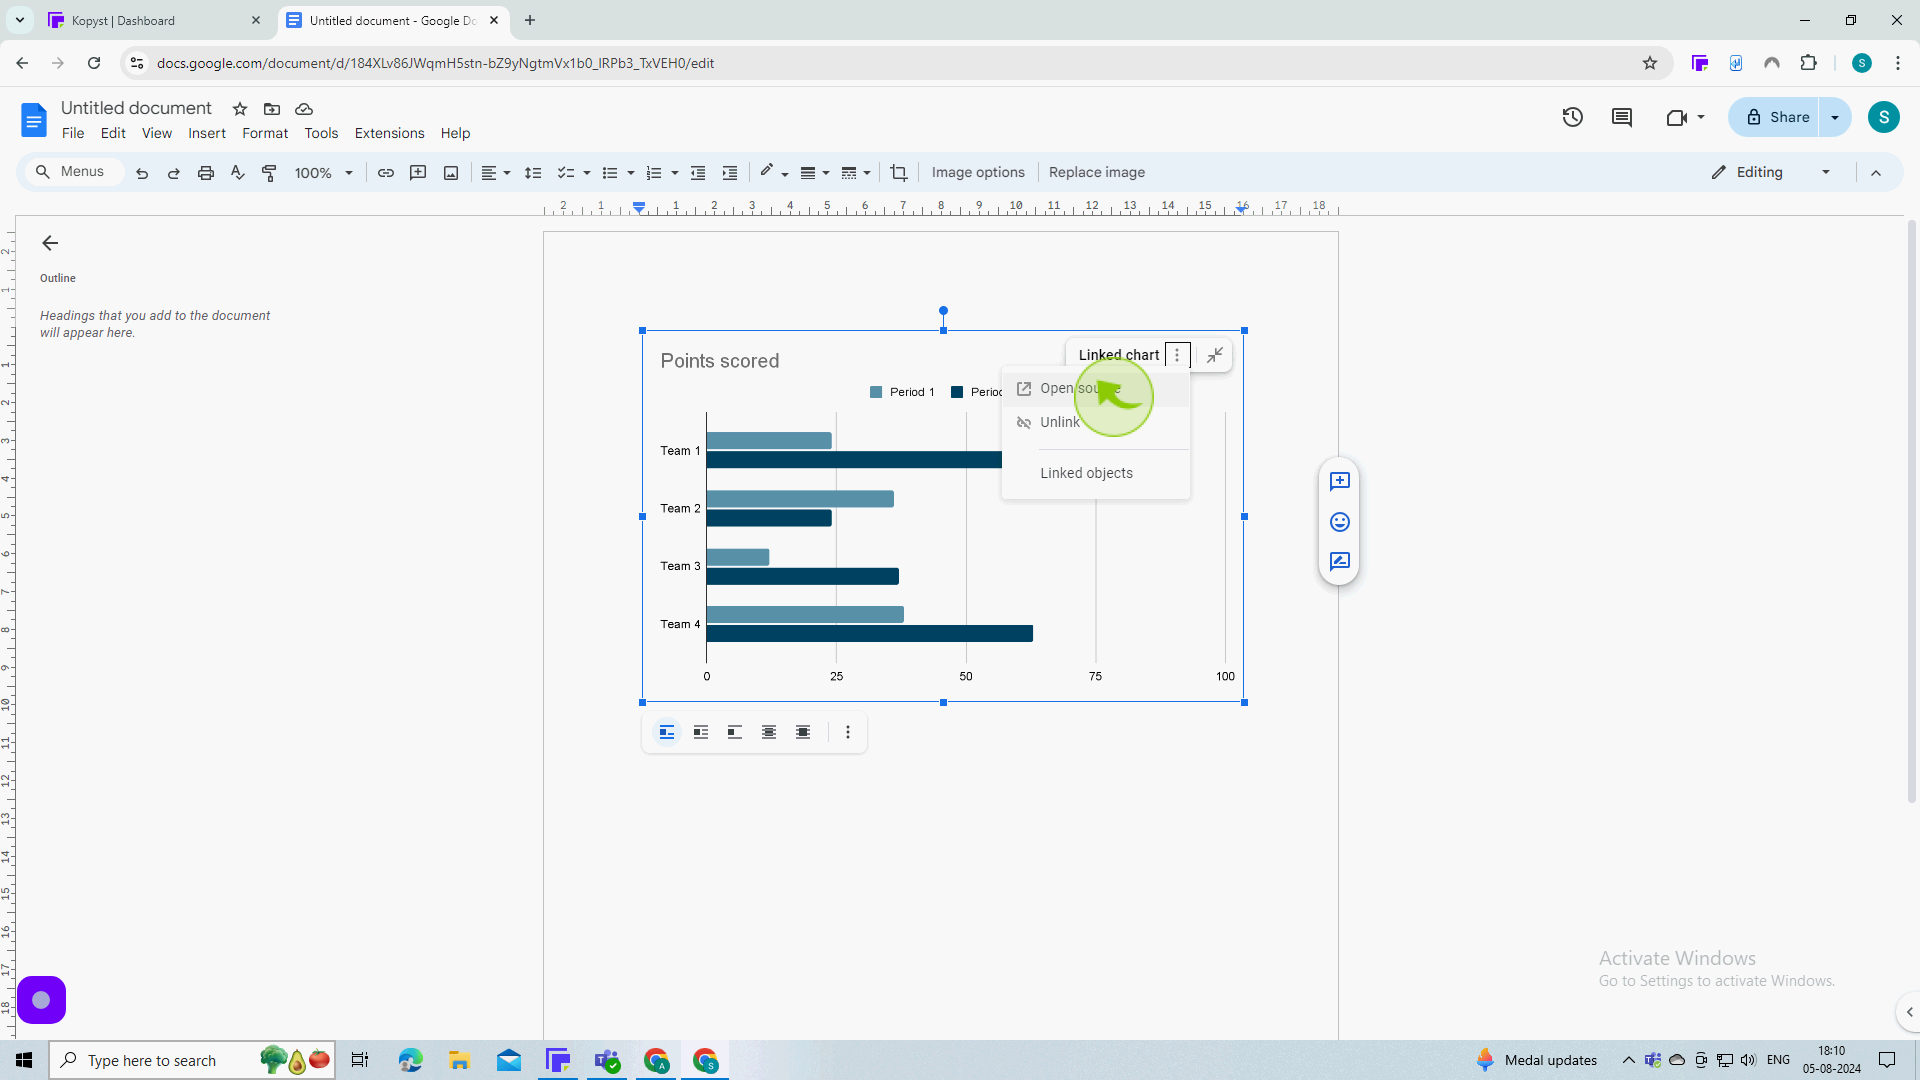
Click on the "Open Source".
7
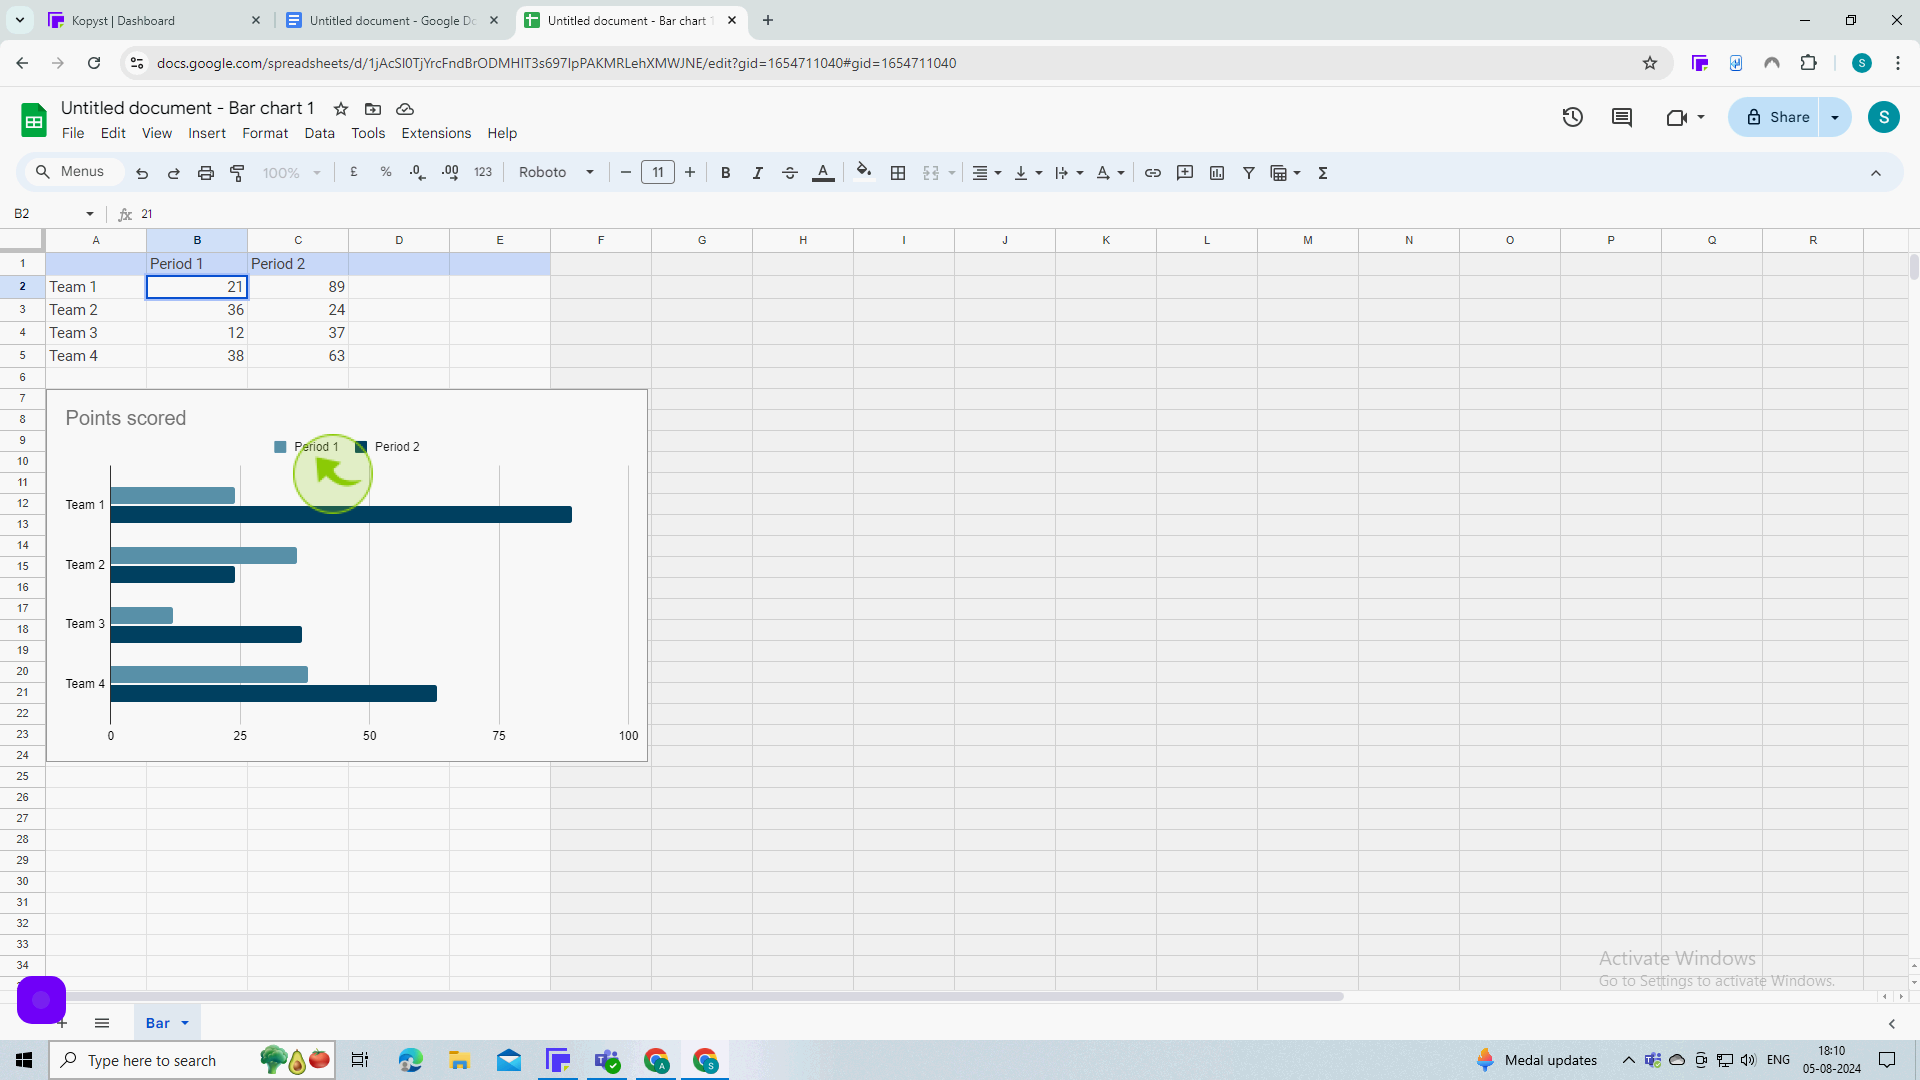
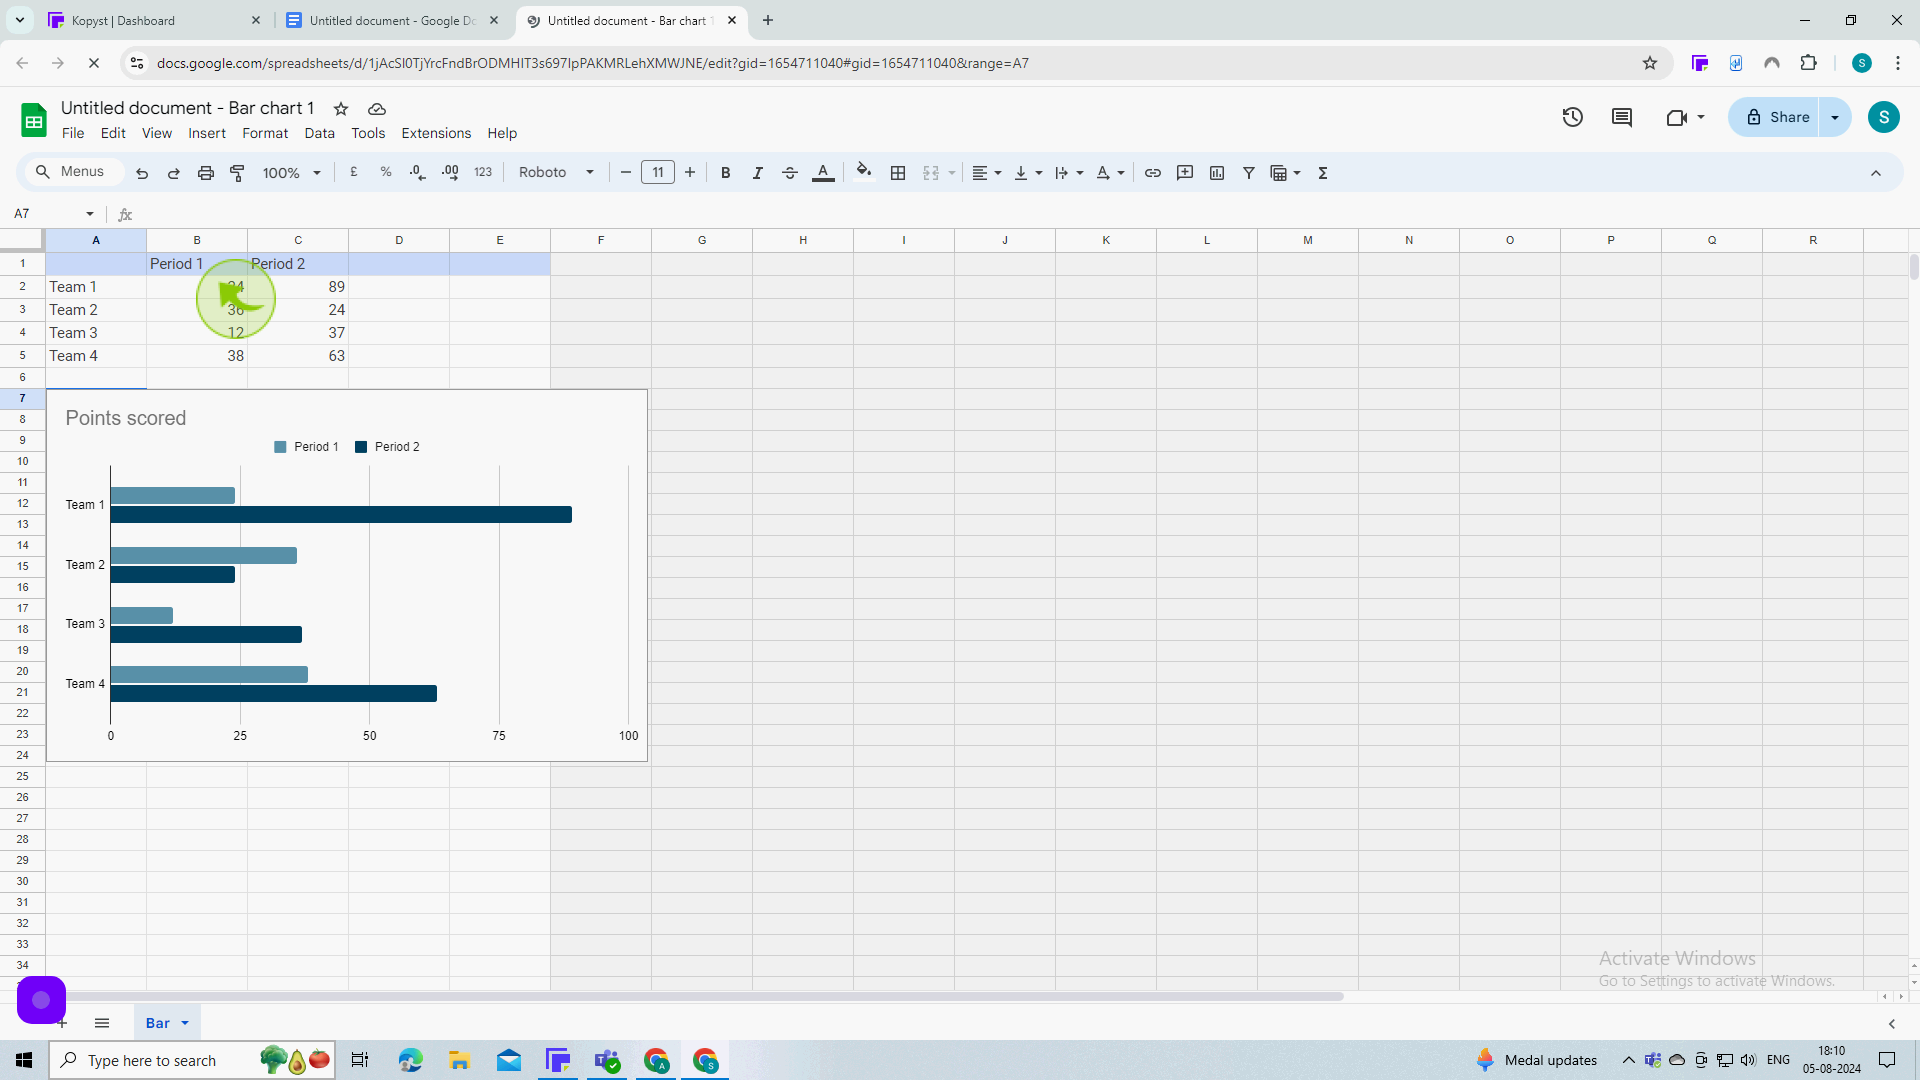
The linked "Google Sheet" will open in a new window.
8
Type "21".
9
Here, you will be able to manipulate the data in your chart to your desires. changes will be reflected instantly.
By following these steps you can make a chart in google docs